
Introduction: Manufacturing KPI Dashboards That Connect Program Delivery With Machine Performance
A machine dashboard flags a downtime spike or a cycle-time drift. Meanwhile, your CNC/DNC system separately logs which program was delivered, whether engineering approved it, and when the machine actually pulled it. Two data streams, two screens, no connection between them.
That gap matters. Many shops struggle with dashboards that show what happened without showing why. Combining program-delivery data with machine performance turns isolated measurements into traceable answers: what happened, where it happened, and what to do next.
This article covers four things:
- Selecting KPIs tied to real decisions
- Connecting program and machine data
- Building views for each shop-floor role
- Turning alerts into corrective action
Key Takeaways
- Track a focused mix of machine, quality, delivery, and CNC/DNC KPIs—not every metric on the floor
- Tie approved program revisions to machine state, output, and quality so issues close in one loop
- Give operators, engineers, and executives separate views on one trusted data foundation
- Require alerts, clear ownership, and drill-downs—not optional dashboard add-ons
What a Manufacturing KPI Dashboard Should Do
A manufacturing KPI dashboard is a visual layer sitting on top of machines, CNC/DNC systems, PLCs, MES/ERP platforms, quality systems, and databases. Its job is to convert raw data into measures tied to operational goals.
Metric vs. KPI: Why the Difference Matters
Not every number on a screen is a KPI. According to ASQ's definition of performance metrics, a metric is simply a figure representing an organization's actions or quality. A metric becomes a KPI only when it's tied to:
- A specific target
- A business objective
- A responsible owner
- A defined review cadence
Downtime minutes is a metric. "Unplanned downtime under 5% by owner: maintenance supervisor, reviewed weekly" is a KPI.
What the Dashboard Needs to Answer
A useful dashboard answers an operational question at a glance:
- Is this job on schedule?
- Is the machine running the approved program?
- Why did first-pass yield drop this shift?
If a screen full of charts can't answer these in under 10 seconds, treat it as a report dump rather than a working dashboard.
What "Real-Time" Actually Means
"Real-time" is thrown around loosely. NIST's industrial control systems guidance draws a hard line between IT systems and industrial control systems. In ICS environments, response time is critical: delay or jitter carries real consequences, and response windows can run from milliseconds to seconds.
Your dashboard needs to distinguish:
- Live machine events (current state, active alarms)
- Delayed or nightly batch reporting (yesterday's scrap totals)
- Manually refreshed data (a spreadsheet someone updates at shift change)
Label the data age on every panel. A dashboard that looks live but updates every four hours will lead to bad decisions.
Selecting KPIs That Connect Program Delivery to Shop-Floor Performance
Start with the decisions the dashboard needs to support. Preventing program-version errors, cutting unplanned downtime, protecting quality, keeping jobs on schedule: pick the measures that inform those decisions, not every number your systems can produce.
Core Machine and Production KPIs
- OEE (Overall Equipment Effectiveness): Availability × Performance × Quality
- Availability: actual run time vs. planned production time
- Cycle time: time to produce one part or complete one process
- Changeover time: last good piece of one run to first good piece of the next
- Planned vs. unplanned downtime: scheduled maintenance separated from failures
- Capacity utilization: share of available machine capacity actually used
Quality and Delivery KPIs
- First-pass yield (FPY): units that pass a process with no rework, retest, or repair
- Scrap and rework rate: material or labor lost to defects
- Schedule attainment: whether work centers hit planned output
- On-time delivery: orders shipped by the promised date vs. total orders
Each KPI reveals a different type of loss. Cycle time alone won't tell you if the part is good. Scrap rate alone won't tell you if the job is late.
Program-Delivery KPIs for CNC/DNC Environments
This is where most dashboards fall short. Three measures specific to CNC/DNC environments deserve their own place on the board:
- Approved-program adoption: Is the machine running the current engineering-approved revision, or an outdated file?
- Transfer success and latency: successful deliveries, failed transfers, retries, and time from request to machine receipt
- Revision mismatch and traceability events: attempts to use outdated or incorrectly assigned programs, tied to machine, job, operator, and timestamp
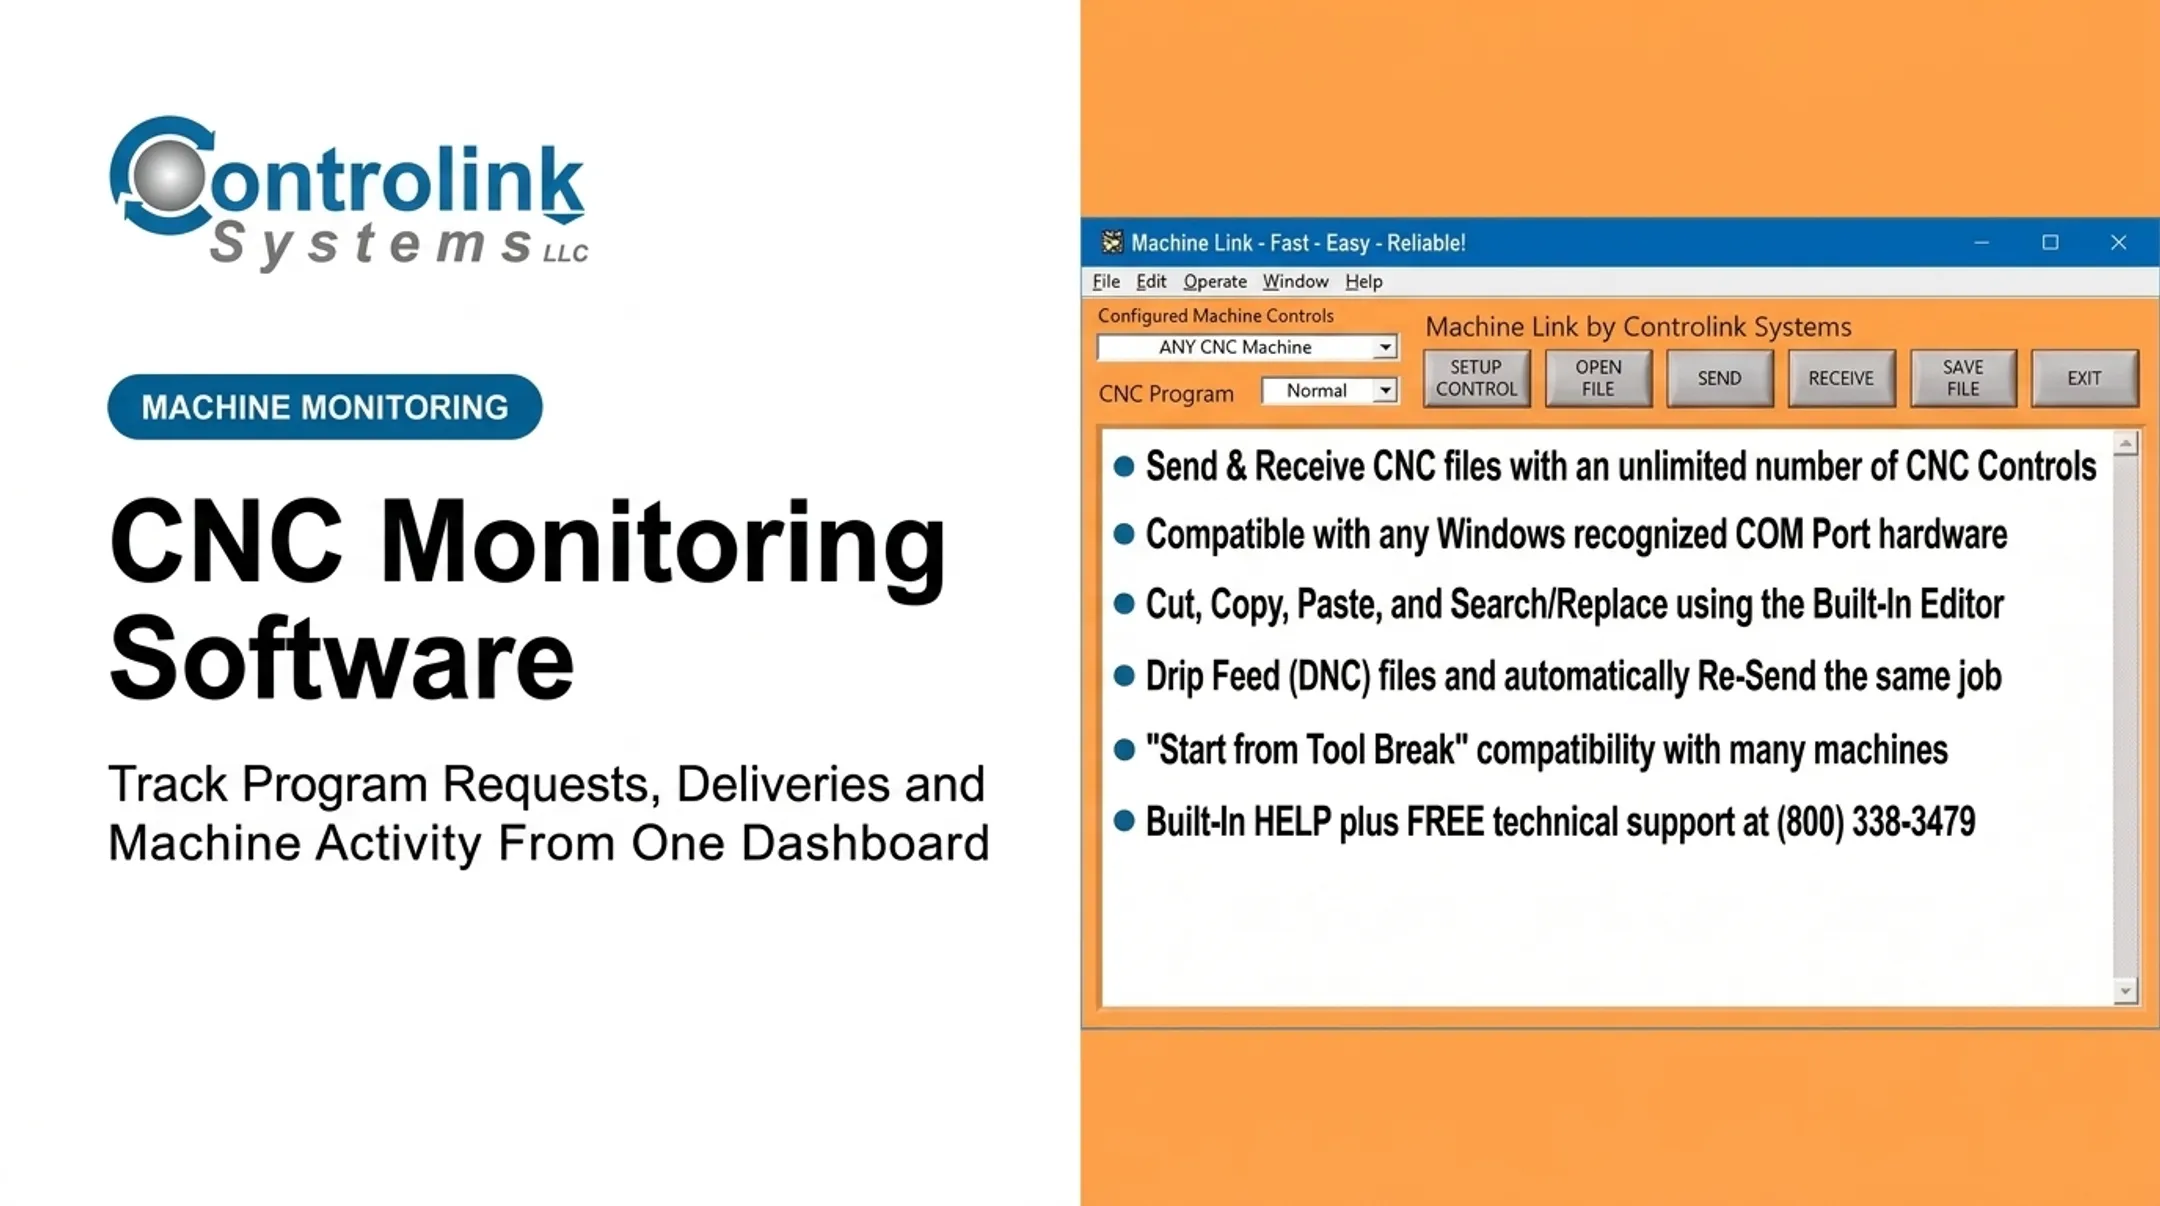
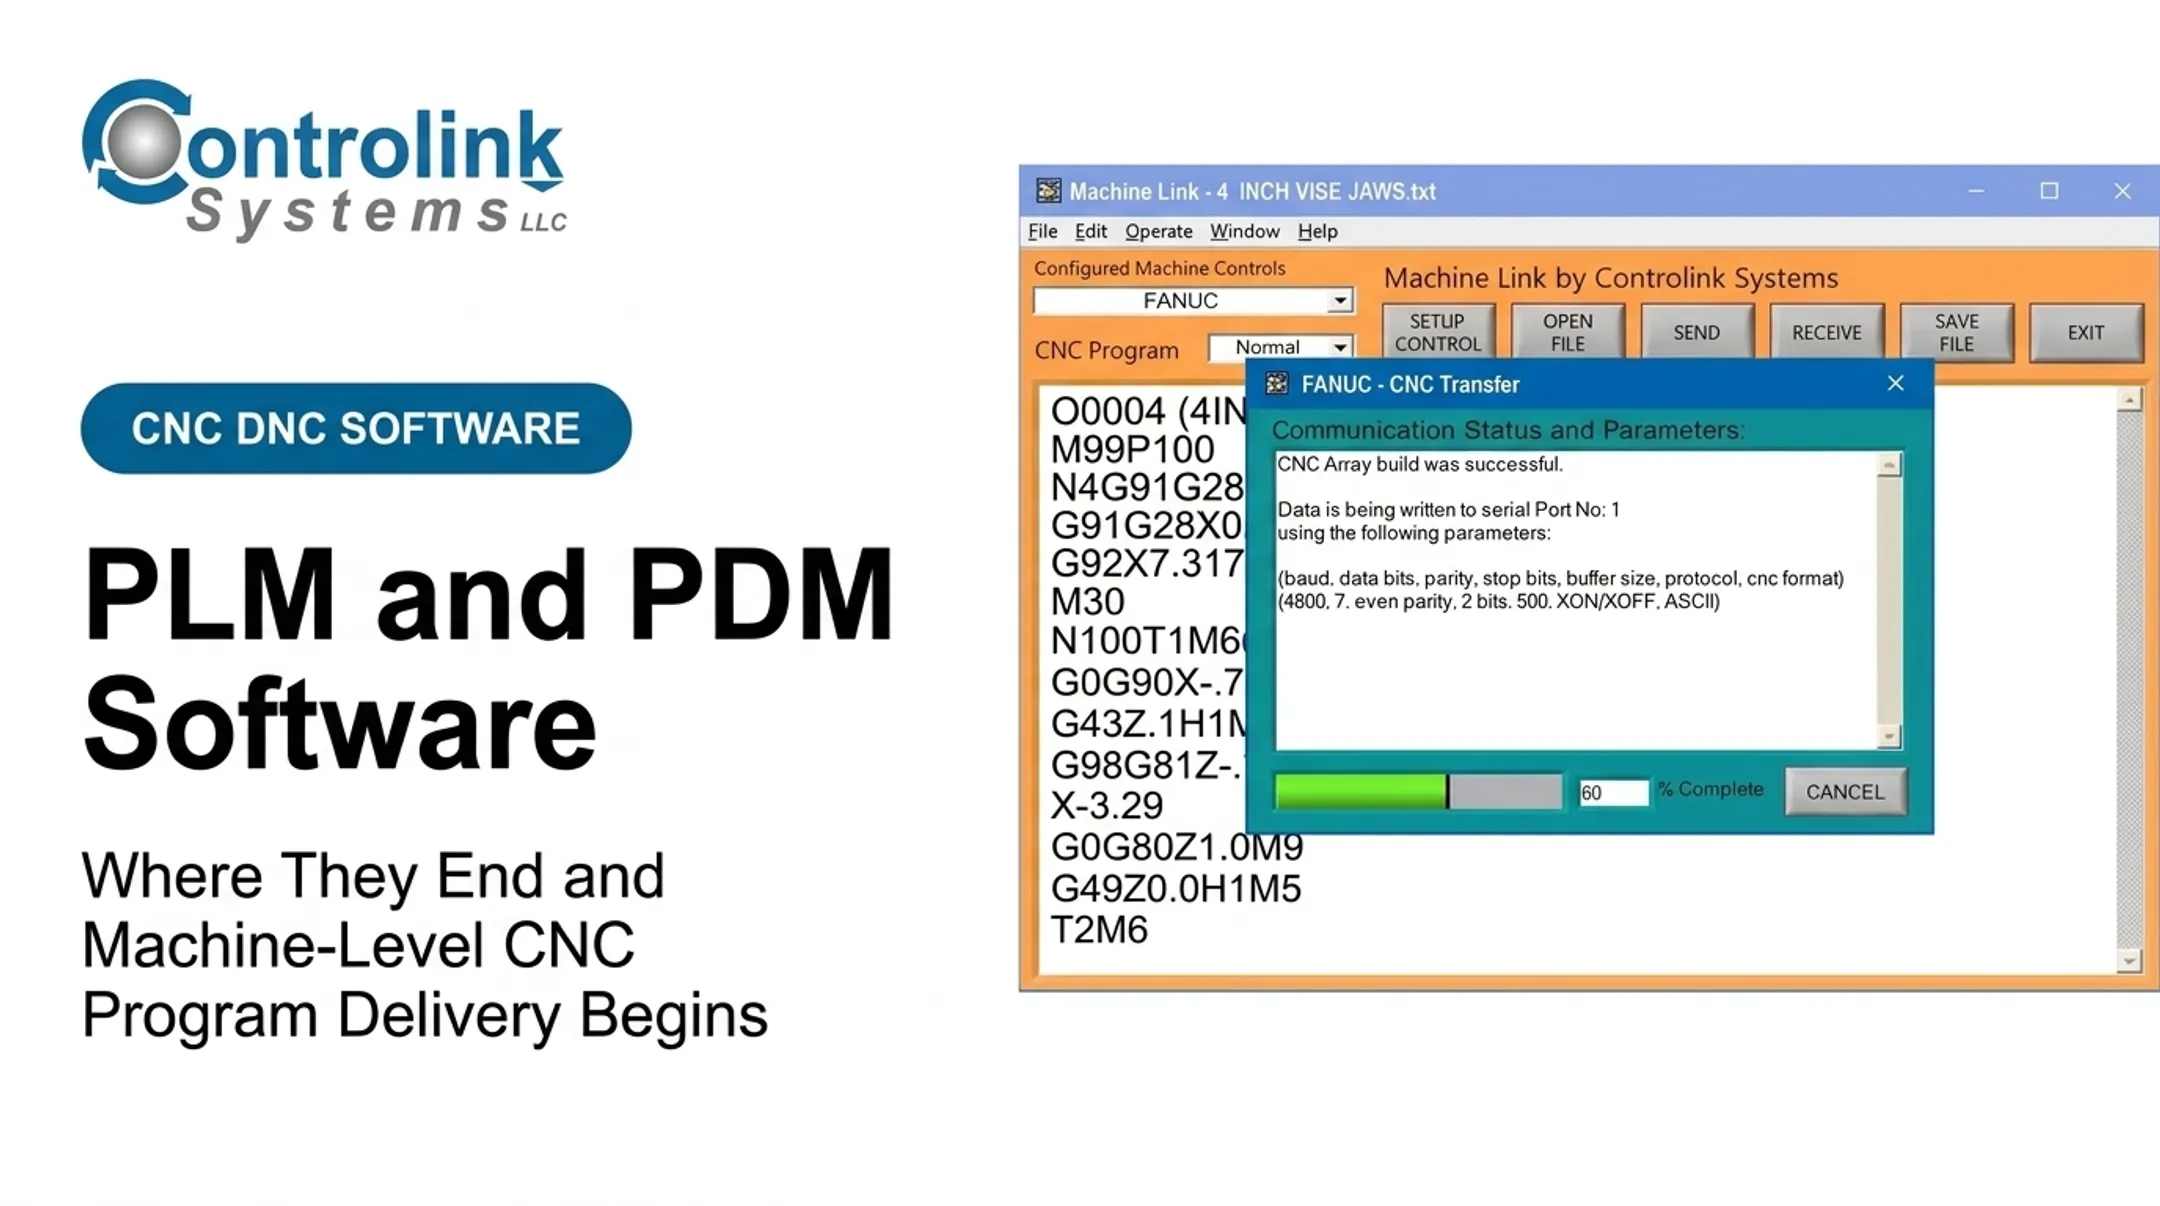
Tracking those three measures only helps if the right file reaches the control every time. Controlink Systems LLC's Machine Link™ QUICK Serve scans machines for remote file requests over wired or wireless serial connections. It returns the latest engineering-approved file directly to the machine control, which cuts the manual file hunting that drives version errors.
Example: a revision mismatch fires on Line 4 at 2:14 PM; the machine requested Rev C but received Rev B. If cycle time on that job climbs 8% over the next hour and scrap ticks up, investigate those signals together. That pairing does not prove the wrong revision caused the scrap. It gives engineering a specific window and machine to check first, instead of guessing across an entire shift.

Building the Data Foundation for a Reliable Dashboard
None of the KPIs above mean anything if the underlying data can't be trusted or joined across systems.
Source Systems and a Common Data Model
Map every source your dashboard will pull from:
- CNC/DNC software and machine controllers
- PLCs, sensors, and HMI interfaces
- MES/ERP platforms
- Quality systems and maintenance records
- SQL databases
Then define a consistent data model so records can be joined across systems:
- Machine ID and work center
- Job/work order and part number
- Program name and revision
- Operator or shift
- Event type, timestamp, and production result
Without shared identifiers, a "downtime event" on the machine side and a "job delay" on the ERP side never connect.
Clocks, Naming, and Data Quality
Synchronized clocks matter more than people expect. If program delivery is timestamped by one clock and machine execution by another, a five-second drift can make a valid sequence look broken.
Basic data-quality controls to put in place:
- Standardize machine and program naming across systems
- Distinguish planned downtime from unplanned downtime explicitly
- Flag missing or duplicate events instead of silently dropping them
- Document manual entries so they're not mistaken for automated records
- Preserve revision history rather than overwriting it
Integration and a Connected Data Flow
Machine-to-enterprise integration typically spans several layers. ISA-95's model places sensors and PLCs at the control level, with MES and ERP systems sitting above them managing operations and business planning. Bridging those layers means secure connections across protocols like CAN, Modbus, Profinet, and EtherCAT.

This is where an engineering partner with cross-system experience earns its place. Controlink Systems LLC has been linking CNC/DNC communications, PLC hardware, motion controllers, and SQL databases since 1998, and has been part of the NI Partner Network since 2000.
Here's what a connected flow looks like in practice, based on how one customer, Ametek, Inc., structured its process:
- A corrected program returns from the machine to a temporary Engineering folder
- A CNC Engineer reviews it and approves it into the CNC program library
- Only after approval is the program released for delivery to the floor
That review step (the folder holding the file) is where the audit trail should capture who approved what, and when.
Designing Role-Based Dashboard Views for the Shop Floor and Plant
The same underlying data needs to look different depending on who's looking at it. An operator doesn't need OEE trend lines. A plant manager doesn't need individual G-code line numbers.
Operator and Supervisor View
This view covers the current shift only:
- Machine state (running, idle, alarm)
- Job progress: target vs. actual output
- Active downtime reason
- Current program revision on the machine
- Immediate action prompts when something's off track
Engineering and Continuous-Improvement View
Engineers need drill-down access, not summaries:
- Program revision history and transfer failures
- Recurring downtime causes by machine or shift
- Cycle-time and scrap trends broken down by program revision
Controlink Systems' Stamping Process Monitor, for example, tracked cycle time for every die hit across six 20-ton progressive-die press lines from a single PC, along with downtime reason codes. That granularity helps engineering teams spot patterns operators can't see shift to shift.
Plant-Management and Executive View
This view aggregates. It doesn't drill:
- Throughput and OEE trends across lines
- Quality and schedule attainment
- Program-control exceptions as a count, not a list
Usability basics that apply to every view:
- Readable at shop-floor viewing distances
- Visible timestamps and units of measure
- Consistent navigation
- Clear signal when data is stale
Turning Dashboard Signals Into Action
A dashboard that just displays numbers without triggering a response is a reporting tool. To be actionable, it needs thresholds and a defined path from alert to resolution.
Setting Thresholds and Escalation Rules
Define specific trigger conditions:
- Repeated program-transfer failures on the same machine
- A machine running an outdated program revision
- Cycle time drifting outside normal range
- Unplanned downtime extending past a set duration
- First-pass yield trending down over several shifts
Every alert needs four things: who owns it, how urgent it is, which machine or job is affected, and what the next step should be. Skip any of these and the alert becomes noise.
Closed-Loop Review Process
An alert without follow-through doesn't fix anything. The loop should run:
- Acknowledge the alert
- Investigate the evidence : pull the event timeline, program history, and quality record
- Correct the process or program
- Document the resolution
- Verify the KPI returned to range

Some systems in the field already work this way. Controlink's FlowLink, for instance, shows a supervisor each technician's active status and work duration, flagging anyone running over average repair time . This is a small, specific version of the same closed loop.
Don't set thresholds once and walk away. Review KPI definitions and priorities as products, machines, and processes change. A dashboard is not a set-and-forget reporting screen.
Implementation Checklist for a Manufacturing KPI Dashboard
Trying to integrate every plant system at once is how these projects stall. Start narrow.
- Pick one high-value workflow first — CNC program delivery and revision control for a critical machine group is a good starting point, not a full-plant rollout
- Assign ownership explicitly — name who approves programs, who handles alerts, and who owns KPI definitions across engineering, operations, and IT
- Validate against source records — cross-check dashboard numbers against shop-floor observations before using them for real decisions
- Pilot with real users — gather feedback on thresholds, layout, and permissions before scaling to more machines
- Set governance rules — access control, audit trails, revision backups, and change management so the data stays trustworthy over time
A narrow pilot still moves fast when program delivery and machine links are straightforward. Controlink Systems LLC builds CNC/DNC and shop-floor tools for everyday machining environments, so teams can connect a critical machine group, prove the metrics, and expand only after the data earns trust on the floor.
Frequently Asked Questions
What are the top 10 KPIs for manufacturing?
A solid set usually covers OEE, throughput, cycle time, downtime, first-pass yield, scrap rate, changeover time, schedule attainment, on-time delivery, and program-delivery or revision-control performance. Choose the mix that matches your plant’s goals and constraints.
What are examples of good KPI dashboards?
Useful setups include operator shift, engineering program-traceability, maintenance/downtime, and plant-management dashboards. Give each clear ownership, live data, a few focused metrics, and drill-down access.
What are some examples of real-time monitoring systems?
Shops often use CNC/DNC monitoring, PLC/machine monitoring, OEE and downtime tracking, MES platforms, process historians, and connected quality systems. How “real-time” it feels depends on the data connection, not the product name.
Which KPIs should be included in a CNC program-delivery dashboard?
Track approved-program usage, revision mismatches, transfer success rate and latency, failed or retried transfers, job-to-program traceability, and machine acknowledgment. Link those events to related quality or production outcomes.
How do you connect machine data to a manufacturing KPI dashboard?
Connect machine controllers, PLCs, CNC/DNC systems, MES/ERP platforms, and quality systems through a shared data model. Use common IDs, synchronized timestamps, validation rules, and secure access controls.
What is the difference between a real-time manufacturing dashboard and a reporting dashboard?
A real-time dashboard shows current shop-floor events so you can act now. A reporting dashboard uses scheduled or historical data for trends—and a polished UI alone doesn’t mean the data is live.