Introduction
A production supervisor walks the floor at 2 PM, checking progress on a rush order that should have shipped by end-of-shift. The CNC cell that started the job at 6 AM shows only 340 parts in the bin—well short of the 600-unit target. After questioning the operator, the supervisor learns that the machine went down for 90 minutes mid-morning due to a tool offset error that wasn't caught until the third reject part triggered a manual inspection. By the time the problem is identified, corrected, and restarted, the shift has lost three hours of capacity, $4,000 in scrap material, and the ability to meet the customer's delivery deadline.
That scenario plays out across discrete manufacturing every day — and the price tag is staggering. According to Siemens' 2024 True Cost of Downtime report, unplanned downtime costs Fortune 500 manufacturers $1.4 trillion annually, equivalent to 11% of total revenues.
The average facility loses more than 15 hours per week to equipment stoppages — many of which go undetected for hours when plants rely on end-of-shift reporting.
Production tracking solves this problem by systematically monitoring output, downtime, cycle time, and quality across manufacturing operations in real time. What follows breaks down the metrics that matter, how to collect them without disrupting the floor, and what good tracking actually looks like in practice.
Key Takeaways
- Production tracking monitors output, downtime, cycle time, and quality in real time to keep operations on target
- Automated tracking using sensors and PLCs delivers 99.6% data accuracy versus 70% with manual methods
- Problem detection drops from hours to seconds with real-time visibility — stopping losses before they compound
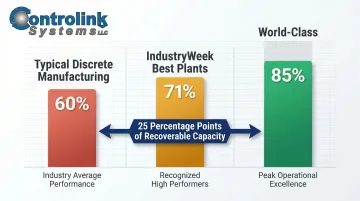
- The gap between typical OEE (60%) and world-class (85%) represents 25 percentage points of recoverable capacity
- Start with 3-5 KPIs, connect machines to data sources, and build a clear response process
What Is Production Tracking in Manufacturing?
Production tracking is the continuous process of monitoring, recording, and analyzing manufacturing activity—from raw material input through finished product output. The goal is to give decision-makers an accurate, real-time picture of shop floor performance so teams catch and correct problems before they escalate.
Unlike broader manufacturing monitoring—which covers energy consumption, machine health, and labor performance—production tracking focuses specifically on output-level metrics:
- Units produced vs. target
- Downtime events and root causes
- Cycle time deviations
- Quality results and defect rates
Production tracking feeds directly into KPI measurement and continuous improvement programs. It is the foundational data layer that makes informed scheduling, maintenance decisions, and capacity planning possible. Without it, a shop running behind on a critical order may not know until a deadline is already missed.
What Does Production Tracking Monitor? Core Metrics Explained
Production Output
Output tracking measures the number of units (or length, volume, etc.) produced in a given period and compares it against targets. This is the most basic signal of whether a line is on pace—deviations from plan trigger the first-level alert.
Industry benchmark: IndustryWeek Best Plants—representing award-winning facilities—achieve a median 95% on-time delivery rate. By comparison, the average metal fabricator achieves only 84% on-time delivery, according to the Fabricators & Manufacturers Association's 2024 financial survey. The 11-percentage-point gap reflects the difference between facilities with reliable output visibility and those operating on delayed or incomplete data.
Downtime
Production tracking distinguishes between planned downtime (changeovers, scheduled maintenance) and unplanned downtime (machine failures, material shortages, setup errors). Recording both the frequency and duration of stops—along with coded reasons—enables root cause analysis and eventually reduces recurring failures.
Key insight: Even among high-performing plants, reactive (unplanned) maintenance accounts for a median of 19% of total maintenance work. Facilities that drive this ratio below 10% achieve it through systematic downtime tracking that feeds preventive maintenance programs.
Cycle Time
Cycle time is the elapsed time to complete one unit or production cycle. Deviations from standard cycle time are early signals of tooling wear, process drift, or speed loss before they escalate into larger quality or output problems.
Tracking cycle time at the machine level allows operators and engineers to intervene when a process begins slowing down—often catching issues hours before they result in downtime or scrap.
Quality Rate and Scrap
Quality tracking records the number of first-pass acceptable units versus total units produced, commonly called first-pass yield. The gap between top performers and the average shop is wide:
| Benchmark | First-Pass Yield | Cost of Poor Quality |
|---|---|---|
| IndustryWeek Best Plants | 95.3% | 0.6% of sales |
| General Manufacturing Average (IISE) | — | ~15% of sales |
| General Manufacturing Range (IISE) | — | 5%–35% of sales |
That ~14-point cost gap is recoverable margin — shops tracking quality in real time can systematically close it through faster defect detection and root cause response.
CNC-specific insight: In machining environments, scrap driven by outdated or incorrect program files is a costly, often-overlooked loss. According to CNCmachines.com, inconsistent tool setup techniques cause 7-15% higher scrap rates and cost shops $50,000-$160,000 per year in hidden losses.
Ensuring machinists always run the latest engineering-approved files is a direct lever on quality rate. Production tracking systems that integrate DNC (Distributed Numerical Control) file management enforce version control at the point of use, eliminating a common and preventable scrap source.
OEE (Overall Equipment Effectiveness)
OEE is a composite metric combining Availability (uptime), Performance (speed), and Quality (first-pass yield) into a single efficiency score from 0–100%. OEE is the standard benchmark for comparing machines, shifts, and facilities over time.
Industry benchmarks:
- Typical discrete manufacturing: 60% OEE
- IndustryWeek Best Plants median: 71% OEE
- World-class: 85% OEE
The gap between typical (60%) and world-class (85%) represents 25 percentage points of recoverable capacity. Even the median Best Plants score of 71% falls 14 points short of world-class. Closing that gap starts with knowing exactly where losses occur — which is precisely what OEE tracking, broken down by Availability, Performance, and Quality, makes visible.
Why Production Tracking Matters: Key Benefits for Manufacturers
Faster Problem Response
Real-time visibility means a supervisor sees a line fall behind within minutes, not at the end of a shift. The earlier an issue is spotted, the more options exist to recover output or address the root cause before it compounds.
Example: A machine experiencing gradual cycle time drift from 45 seconds to 52 seconds over two hours may go unnoticed in a manual logging environment. With automated tracking, the 15% slowdown triggers an alert within 20 minutes, allowing the operator to inspect tooling before the cycle extends further or quality degrades.
Reduced Scrap and Rework
By monitoring quality deviations at the machine level as they happen, production tracking allows operators and engineers to intervene before an entire batch is scrapped.
CNC-specific benefit: In machining environments, combining production tracking with accurate DNC/program file management ensures the correct revision is in use. Shops using structured file version control report scrap reductions comparable to the broader 7-15% improvement range documented for setup error elimination.
Data-Driven Scheduling and Resource Allocation
Accurate output and capacity data from tracking systems replaces guesswork in production scheduling. Manufacturers can promise accurate lead times, rebalance workloads across machines, and avoid both overloading critical assets and underutilizing others.
IndustryWeek Best Plants data shows that 59% of high-performing plants update their Master Production Schedule daily, with 22% updating weekly. Frequent schedule updates reflect the gap between plan and reality. Production tracking provides the real-time feedback loop that keeps schedules aligned with actual capacity.
Maintenance Alignment
Downtime data from production tracking feeds directly into maintenance planning—identifying which assets fail most frequently, which failure modes recur, and whether recent maintenance work actually improved reliability.
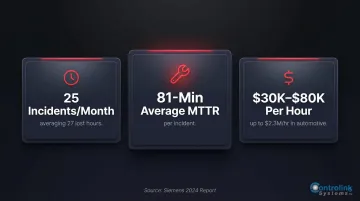
Cost context: According to the Siemens 2024 True Cost of Downtime report, the average manufacturing facility experiences:
- 25 unplanned downtime incidents per month, totaling 27 lost hours
- 81-minute average MTTR per incident
- $30,000–$80,000 per downtime hour in general manufacturing; $2.3 million per hour in automotive
Tracking systems that capture downtime reasons enable maintenance teams to prioritize interventions based on actual business impact rather than perceived urgency.
Continuous Improvement and Accountability
Consistent, standardized tracking data provides the baseline needed for Lean, TPM (Total Productive Maintenance), or Kaizen initiatives. Without reliable baselines, there is no way to confirm whether process changes actually improved performance, or to hold teams and lines accountable to established targets.
IndustryWeek Best Plants demonstrate median 3-year improvements of -22% in in-plant defect rates and -25.1% in scrap/rework costs. These gains are directly attributable to systematic tracking and data-driven improvement programs.
Tools and Methods for Tracking Production on the Shop Floor
Manual Tracking
Paper count sheets, whiteboards, and spreadsheets are a valid starting point for smaller operations or pilot programs. Operators record output counts, downtime events, and quality issues at regular intervals throughout the shift.
Key limitations:
- Data is only available at end-of-shift
- Micro-stoppages (1-5 minutes) are routinely missed
- Transcription errors reduce decision-making quality
- Operators estimating downtime duration introduce 20-30% variance
The Manufacturing Leadership Council reports that 70% of manufacturers still collect and enter production data manually, while only 30% use manufacturing data to predict operational performance. For most facilities, manual tracking is a starting point—not a finish line.
Automated Tracking with Sensors and PLCs
Automated tracking uses sensors—photoelectric counters, current sensors, vibration sensors—or direct PLC/SCADA signals to capture production events continuously without operator input. These systems record every cycle, every stoppage, and every quality rejection in real time.
The accuracy gains are significant. A Rockwell Automation/Plex case study showed a food and beverage supplier improving inventory accuracy from 70% with manual methods to 99.6% with MES technology—a 29.6-percentage-point improvement.
That data flows to dashboards accessible from desktops or mobile devices, eliminating the need to physically walk the floor to check status. Shop-floor automation software—such as the solutions from Controlink Systems LLC—can link CNC machines, PLC hardware, and data collection systems through protocols including Modbus, Serial, Profinet, and EtherCAT. Manufacturers get a connected view of machine performance without replacing existing equipment.
Controlink's Machine Link™ QUICK Serve product line takes this further—continuously monitoring CNC machines and serving approved program files directly to machine tool controls, so operators always run the latest engineering-approved revisions. The system scales from small shops to enterprise facilities and connects legacy equipment through RS-232 without requiring controller replacement.
Manufacturing Execution Systems (MES) and Production Monitoring Platforms
MES software manages and monitors production operations end-to-end—work orders, scheduling, labor, and materials. Production tracking is one core functional component within most MES platforms.
Within the Purdue Reference Model, MES sits at Level 3—the layer between ERP/business planning (Level 4) and process control (Levels 1-2). According to MESA International, roughly 90% of operational technology (OT) data is generated at Levels 0-3, which makes MES the natural aggregation point for production tracking data.
Two data points show how quickly MES has shifted from optional to foundational:
- The global MES market was valued at $14.88 billion in 2024 and is projected to reach $41.78 billion by 2032 at a 14.1% CAGR (Fortune Business Insights)
- Approximately 90% of OT data originates at the shop-floor levels where MES operates
Standalone production monitoring tools can also run independently and connect to ERP or MES platforms through APIs or database links. Controlink's systems routinely interface with SQL databases, letting data move between shop-floor tracking software and enterprise planning systems without manual re-entry.
Hybrid Approach—Combining Automation with Operator Input
Many plants use a hybrid method where automated counters and downtime sensors handle machine-level data, while operators add context codes (e.g., distinguishing a changeover stop from an equipment failure) through a simple HMI terminal.
Why operator input matters: Sensors capture the "what" and "when," but operators provide the "why." A two-minute stoppage could represent a planned material change, an emergency stop due to a quality concern, or a mechanical failure. Context codes ensure downstream analysis categorizes events correctly.
Controlink's engineering services emphasize developing "understandable, user-friendly HMI interfaces that reduce training costs and improve productivity," enabling operators to provide context without disrupting workflow.
How to Implement Production Tracking: A Step-by-Step Approach
Step 1: Define What to Track and Set Targets
Implementation begins by identifying the 3–5 metrics that matter most for the operation, setting a target value for each before any data is collected, and deciding the level of granularity needed (machine, line, or plant).
Example starter metrics:
- Production output vs. daily target (units/shift)
- Unplanned downtime (minutes/shift)
- First-pass yield (% good parts)
- Cycle time (seconds/unit)
- OEE (composite %)
Without targets, deviations cannot be recognized and acted on. A line producing 450 units per shift means nothing unless the target is 500—only then does the 50-unit gap become visible as a problem requiring investigation.
Step 2: Connect Machines and Identify Data Sources
Each required metric must be mapped to a specific data source—PLC signal, dedicated sensor, operator terminal, or ERP import—before purchasing or configuring anything.
Start with a connectivity assessment: check whether existing equipment can transmit relevant data or requires additional hardware. That answer drives both cost and timeline.
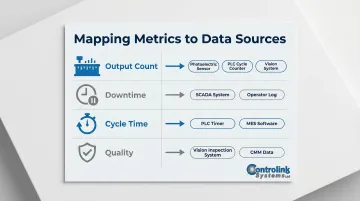
Common data sources:
- Output count: Photoelectric sensor at part exit, PLC cycle counter, vision system
- Downtime: PLC status signal, current sensor (detects motor on/off), operator input terminal
- Cycle time: PLC timestamp at cycle start/end, encoder pulse count
- Quality: Vision inspection reject signal, operator terminal input, automated gauge reading
Legacy equipment is a common sticking point here. For CNC machines that lack native data outputs, Controlink's engineering services cover sensor selection, integration, and calibration across diverse industrial equipment — including wireless networking solutions (MOXA hardware) that connect RS-232 and Ethernet systems without extensive rewiring.
Step 3: Choose a Display Method and Build a Response Process
Once data is flowing, the display method should match who's reading it:
- Operators need simple real-time counts and alerts
- Supervisors need shift summaries and deviation flags
- Managers need trend comparisons and OEE scorecards
Critical requirement: Tracking without a defined response process produces data no one acts on. Before going live, document:
- Who receives alerts for each type of deviation
- What the escalation path is
- How findings are reviewed at shift-end
Example response process:
- Output falls 10% below target → Operator alert on HMI
- Output falls 20% below target → Supervisor mobile alert
- Unplanned downtime exceeds 5 minutes → Maintenance notification
- First-pass yield drops below 95% → Quality engineer email
Controlink's FlowLink repair center automation system demonstrates this principle: the system displayed real-time status on "a large display board, somewhat like a scoreboard," so everyone knew current status throughout the day, then automatically prioritized and assigned work based on defined business rules.
Frequently Asked Questions
What is the meaning of product tracking?
Production tracking (sometimes called product tracking) is the systematic process of monitoring and recording manufacturing activity—including output quantities, machine status, quality results, and process performance—to give plant teams an accurate, real-time view of operations so problems can be identified and addressed without delay.
How to track production process?
Tracking the production process begins with selecting key metrics (output, downtime, cycle time, quality) and connecting machines to a data source—sensors, PLC signals, or operator terminals. That data feeds a dashboard accessible to operators and managers, with a defined response process so deviations from target trigger immediate action.
What are the 5 KPIs for manufacturing?
The five most widely used manufacturing KPIs are: OEE (Overall Equipment Effectiveness), production output vs. target, downtime (planned and unplanned), first-pass quality rate, and cycle time. OEE is the composite benchmark that combines availability, performance, and quality into a single score.
What are the 5 stages of the production process?
The five general stages are: raw material input, work-in-progress (machining, assembly, or processing), quality inspection, finished goods output, and delivery/dispatch. Production tracking applies at each stage to catch bottlenecks early and stop defects before they move downstream.
Can AI do production scheduling?
Yes. AI-powered systems can automate scheduling by analyzing machine availability, order priorities, and cycle times in real time. That said, according to Redwood Software (2026), only 20% of manufacturers are operationally ready for AI—often because their underlying tracking data isn't reliable enough. Accurate production tracking is the foundation any AI scheduling tool depends on.
What are the 5 M's of manufacturing?
The 5 M's—Man, Machine, Material, Method, and Measurement—represent the five key input categories in any manufacturing process. Production tracking provides the Measurement layer that evaluates how effectively the other four inputs are performing at any given time.
Ready to eliminate delayed problem detection and recover hidden capacity on your shop floor? Controlink Systems LLC has been developing shop-floor automation and process monitoring solutions since 1998, helping manufacturers increase productivity, reduce scrap, and improve machine utilization through reliable, real-time data collection.
Contact Controlink at (800) 838-3479 or support@controlinksystems.com to discuss your production tracking requirements and discover how automated monitoring can put accurate, real-time data in front of your operators and managers where it matters most.