Introduction
Manufacturing managers face a persistent challenge: machines generate enormous amounts of data every shift, but most of it either goes uncaptured or is reviewed hours or days too late to prevent unplanned downtime, scrap runs, or missed production targets. Unplanned downtime costs industrial manufacturers an estimated $50 billion annually, with median per-incident costs exceeding $125,000 per hour. In the automotive sector alone, this figure skyrockets to $2.3 million per hour.
Real-time operational analytics bridges this gap by converting raw machine data into actionable intelligence as events occur — not hours later when the damage is already done.
This guide covers what real-time operational analytics is, why it matters, its key components, manufacturing use cases, and how to implement it in your facility. The perspective here is manufacturing-specific, drawing on Controlink Systems' 25+ years developing process monitoring and shop-floor automation solutions for machine shops, automotive plants, and precision manufacturers.
Key Takeaways
- Real-time operational analytics means acting on shop-floor data as it's generated — not hours after the fact
- Catch quality issues and reduce downtime without waiting for end-of-shift reports
- Core components: data acquisition, stream processing, dashboards, and alerting
- Common use cases include CNC monitoring, scrap reduction, OEE tracking, and predictive maintenance
- Start by connecting machines to a data collection layer — analytics come after
What Is Real-Time Operational Analytics?
Real-time operational analytics is the continuous process of ingesting, processing, and analyzing data from operational systems — machines, sensors, PLCs, production lines — as events occur, with the goal of enabling immediate action or decision-making.
Real-Time vs. Batch Analytics
Batch analytics processes data in scheduled intervals, such as end-of-shift or daily reports. Real-time analytics delivers insights within seconds or minutes of an event. The implication is significant: by the time a batch report surfaces a problem, thousands of scrap parts may have already been produced.
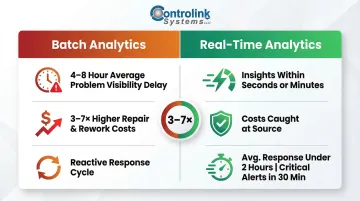
According to The Lean Suite, citing Manufacturing Leadership Council data, that gap carries a steep cost:
- Conventional shift reports delay problem visibility by 4-8 hours on average
- Detection delays multiply repair and rework costs by 3-7× compared to catching the issue immediately
- Real-time dashboard deployments cut average response time to under 2 hours, with critical alerts resolved within 30 minutes
Operational vs. Business Analytics
Operational analytics focuses on monitoring and optimizing live processes — machine uptime, cycle times, defect rates. Business analytics focuses on higher-level KPIs and historical trends. The two work together: shop-floor operational data feeds upward into broader business intelligence, but the real-time layer is where problems get caught before they compound into shift-wide losses.
Why Real-Time Operational Analytics Matters in Manufacturing
The Cost of Delayed Insight
Undetected tool wear, process drift, or machine faults that go unnoticed during a shift can result in large batches of scrap, missed delivery windows, and costly rework. According to the American Society for Quality, the Cost of Poor Quality (COPQ) typically consumes 15% to 20% of total sales revenue for many manufacturers. In discrete manufacturing, scrap and rework alone can account for 0.6% to 2.2% of revenue.
The OEE Connection
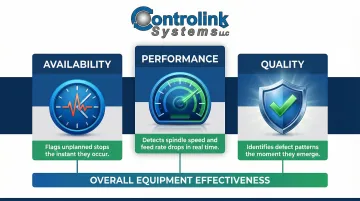
Real-time analytics directly improves the three OEE (Overall Equipment Effectiveness) pillars:
- Availability: Flags unplanned stops immediately, enabling faster response to breakdowns or changeovers
- Performance: Detects sudden drops in spindle speed or feed rate that signal tool wear or process drift
- Quality: Identifies defect patterns as they emerge, preventing entire batches from being scrapped
For example, a sudden drop in spindle speed during a milling operation can indicate tool wear. Real-time monitoring alerts the operator immediately, allowing tool replacement before defects occur. Without real-time visibility, the operator might complete an entire batch before discovering undersized features on inspection.
Faster, More Confident Decision-Making
Real-time visibility enables supervisors and engineers to respond to alerts rather than relying on operator intuition or periodic walkthroughs. Digitally mature manufacturers achieve a 28.7% higher Operating Margin and a 52.5% higher Return on Invested Capital compared to their peers, according to LNS Research's 2025 benchmarking study.
Quality and Compliance Benefits
Real-time process data creates an automatic audit trail for industries with strict quality standards — automotive, aerospace, medical devices. Any deviation from approved parameters is logged and flagged immediately. This directly supports compliance with:
- IATF 16949 — automotive quality management
- AS9100 — aerospace quality systems
- ISO 13485 — medical device manufacturing
On-Time Delivery and Scheduling Gains
Real-time data enables scheduling adjustments that lagging indicators simply can't support. In one McKinsey case study, dynamic scheduling tied to real-time variables eliminated a 1-2 hour daily productivity loss and pushed on-time deliveries from 50% to 90%.
Key Components of a Real-Time Operational Analytics System
Data Acquisition Layer
The foundation is connecting machines and equipment to a data collection system. This includes:
- Sensors (temperature, vibration, pressure)
- PLCs (programmable logic controllers)
- CNC controllers
- Communication protocols: Modbus, Profinet, EtherCAT, Serial, CAN
In legacy shop environments, DNC (Distributed Numerical Control) software plays a critical role in extracting data from CNC machines that weren't originally designed for network connectivity. Controlink Systems' process monitoring and DNC software serves as this acquisition layer, linking CNC machines, PLCs, and SQL databases to feed live data upstream.
Challenges with Legacy Equipment:
The average age for CNC machines at top-performing shops is 7 years, while other shops average 10 years, according to Modern Machine Shop's benchmarking data. Older machines often lack native MTConnect or Ethernet capabilities, requiring hardware retrofits or specialized DNC software to capture real-time data.
Stream Processing Engine
Raw data from machines must be processed in-flight before it reaches a dashboard or triggers an alert. Stream processing includes:
- Filtering noise and validating data quality
- Calculating metrics: cycle time, feed rate, spindle load
- Detecting threshold violations in real time
Two Processing Approaches:
- Edge processing: Done at the machine level for low-latency responses
- Centralized stream processing: Aggregates data from multiple machines for facility-wide analytics
Visualization and Dashboards
Real-time dashboards present live KPIs — machine status, production counts, reject rates — in a format operators and supervisors can act on immediately. Effective HMI and dashboard design reduces training costs and cognitive load, a key principle in shop-floor environments.
Dashboard Best Practices:
- Display only actionable metrics (avoid information overload)
- Use color coding for status (green/yellow/red)
- Update every 1-5 seconds for true real-time visibility
- Optimize for glanceability from across the shop floor
Alerting and Anomaly Detection
Rule-Based Alerts:
Trigger when a measured value exceeds a predefined threshold (e.g., temperature > 180°F, cycle time > 45 seconds). Simple to configure and understand, ideal for well-defined processes.
Statistical Anomaly Detection:
Uses historical patterns to identify deviations that don't violate a specific threshold but represent unusual behavior (e.g., gradual drift in cycle time over several hours). More sophisticated, catches subtle issues that rule-based alerts miss.
Both matter in manufacturing: rule-based alerts catch immediate problems, while anomaly detection identifies emerging trends before they become critical.
Integration with Existing Systems
Alerts and analytics only drive results when connected to the systems that act on them. Real-time data integrates with:
- SQL databases for historical trending and reporting
- ERP systems to influence scheduling and inventory decisions
- Quality management platforms to trigger inspection workflows
- Maintenance systems to automatically create work orders
When a threshold violation triggers a maintenance work order automatically — without a supervisor manually filing a ticket — that's where real-time analytics pays off in reduced downtime and faster response.
Real-World Use Cases on the Shop Floor
CNC Machine Monitoring and DNC Integration
Real-time analytics applied to CNC machines allows shops to track:
- Cycle times (actual vs. planned)
- Program execution status
- Spindle utilization and load
- Tool life and wear indicators
DNC software ensures machinists are always running the latest engineering-approved NC programs — directly linking file management to quality outcomes and scrap reduction. Manual data entry and version control failures are silent profit killers. According to CNC Machines, tool offset errors cause low-volume shops to scrap 1–3 parts per month, while high-volume shops can scrap 50+ parts before the error is detected.
Predictive Maintenance and Tool Wear Detection
Continuous monitoring of vibration, spindle load, and temperature signatures allows maintenance to be scheduled based on actual machine condition rather than fixed intervals. Predictive maintenance delivers documented maintenance cost reductions of 18–25% and unplanned downtime reductions of 30–50% versus reactive strategies, according to McKinsey & Company.
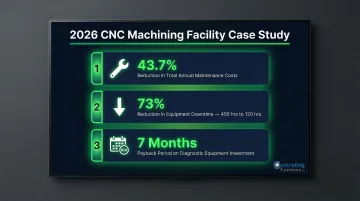
A 2026 industrial case study of a CNC machining facility yielded:
- 43.7% reduction in total annual maintenance costs
- 73% reduction in equipment downtime (from 450 hours to 120 hours)
- 7-month payback period for the required diagnostic equipment investment
End-of-Line (EOL) Testing and Quality Control
Real-time data collection during EOL testing allows every part's test result to be captured, compared against specification limits, and flagged for rejection before it enters the next production stage or ships to the customer.
This creates an automatic audit trail for regulated industries — a compliance requirement across automotive (IATF 16949), aerospace (AS9100), and medical device (ISO 13485) standards.
Overall Equipment Effectiveness (OEE) Tracking
Real-time data feeds OEE calculations continuously — giving production managers a live view of availability, performance, and quality rather than a retrospective score calculated after the shift.
Actual Industry OEE Averages (2025, 1,470+ Discrete Manufacturing Operations):
While world-class OEE is widely cited as 85%, a 2025 analysis of 1,470+ discrete manufacturing operations reveals actual industry averages:
- Medical Devices: 78.2%
- Industrial Equipment: 74.6%
- Electronics: 69.1%
- Aerospace & Defense: 64.7%
- Automotive: 61.8%

These numbers show that most operations have meaningful room to improve. Real-time OEE monitoring enables immediate course corrections (such as reallocating work when a machine falls below performance targets) rather than discovering the problem hours later.
How to Implement Real-Time Operational Analytics in Your Facility
Start with Connectivity
Before any analytics can happen, machines must be connected and data must flow. Start by auditing your existing equipment to map out what you're working with:
- Identify which machines have native network connectivity
- Determine which require adapters or DNC solutions
- Document what protocols are in use (Modbus, Profinet, Serial, etc.)
This connectivity layer is the most critical and often most overlooked step. Controlink Systems has been connecting legacy CNC equipment to modern data environments since 1998 — supporting protocols from Modbus and Serial to Profinet and EtherCAT across shops of every size.
Define Your Key Metrics and Alert Thresholds First
Avoid the common mistake of collecting all available data without a clear plan. Identify 3-5 operational KPIs you need to act on in real time:
- Cycle time variance (actual vs. planned)
- Scrap rate or first-pass yield
- Machine uptime percentage
- Tool life remaining
- Critical process parameters (temperature, pressure, spindle load)
Build the analytics layer around those metrics before expanding scope. Most shops see measurable improvement within the first 30–60 days of focusing on a tight metric set.
Plan for Integration and Scalability
With your core metrics defined, the next question is how the system fits into your broader infrastructure. Real-time analytics platforms should connect to existing SQL databases, ERP, and quality systems from the outset — not as an afterthought. Choose platforms and tools that:
- Support standard protocols and APIs to avoid creating data silos
- Offer user-friendly interfaces that reduce operator training burden
- Can scale from a single machine to facility-wide deployment
- Provide both edge processing and centralized analytics capabilities
Getting these architectural decisions right early prevents costly rework as your data needs grow.
Frequently Asked Questions
What is the difference between real-time analytics and batch analytics?
Batch analytics processes accumulated data at scheduled intervals — such as end-of-shift reports — introducing delays of hours or days. Real-time analytics processes data as it is generated, delivering insights within seconds or minutes so operators can act immediately rather than after the fact.
What are the 4 types of analytics?
The four types are descriptive (what happened), diagnostic (why it happened), predictive (what will happen), and prescriptive (what action to take). Real-time operational analytics spans all four — from tracking live machine status to recommending corrective actions on the shop floor.
What are the 4 pillars of analytics?
The four pillars are data collection, data processing, data analysis, and data visualization. In manufacturing, these map directly to sensor and PLC inputs, stream processing engines, anomaly detection logic, and operator dashboards — each stage working continuously rather than on a scheduled cycle.
How is real-time operational analytics used in manufacturing?
Common applications include:
- CNC machine monitoring — tracking cycle times and program execution
- OEE tracking — live availability, performance, and quality metrics
- Predictive maintenance — monitoring vibration and temperature to schedule repairs before failures
- Scrap reduction — detecting process drift before defects occur
- End-of-line testing — comparing results against specifications in real time
What are the leading services for real-time data insights?
Leading options include purpose-built process monitoring and DNC platforms for machine connectivity, streaming engines for in-flight data processing, and visualization tools for dashboards and alerting. For shop-floor applications, specialized solutions typically outperform generic business intelligence tools — particularly in discrete manufacturing environments.
What are the key components of a real-time operational analytics system?
Five core components make up a real-time analytics system:
- Data acquisition — sensors, PLCs, and DNC software capturing machine data
- Stream processing — filtering and calculating metrics as data arrives
- Dashboards/HMI — visualizing live KPIs for operators
- Alerting and anomaly detection — notifying teams of problems in real time
- ERP/SQL integration — connecting operational data to broader business systems