Introduction
When a critical motor, pump, or gearbox fails without warning, production lines halt, repair costs skyrocket, and delivery schedules slip. Vibration analysis is the most widely used technique in manufacturing for catching developing faults before they become catastrophic failures.
Done well, it addresses multiple operational priorities at once:
- Preventing unplanned downtime
- Reducing repair costs
- Extending asset lifespan
- Maintaining product quality
- Improving workplace safety
The financial stakes are clear. According to the Siemens True Cost of Downtime 2024 report, unplanned downtime costs the world's 500 largest companies $1.4 trillion annually (11% of total revenues). In automotive alone, an idle production line now costs $2.3 million per hour — double what it did in 2019.
Key Takeaways
- Vibration analysis measures oscillation patterns in rotating machinery to detect early signs of wear, imbalance, misalignment, and component degradation
- Every machine has a unique vibration signature; changes in that signature indicate developing faults
- The core workflow runs from sensor selection and data collection through FFT spectrum analysis to fault interpretation and maintenance action
- Detectable faults include shaft unbalance, misalignment, bearing degradation, and mechanical looseness
- Integrating vibration analysis into predictive maintenance programs reduces unplanned downtime, cuts reactive repairs, and extends equipment life
What Is Vibration Analysis?
Vibration analysis is the process of measuring and interpreting the oscillation patterns (vibration signatures) of rotating machinery to assess machine health, identify anomalies, and predict developing faults before they cause failure. It provides objective, data-driven evidence that a component is degrading, allowing maintenance teams to intervene at the optimal time—not too early, not too late.
Where It's Applied:
Vibration analysis is applied to rotating assets across most industrial environments, including:
- Motors and generators
- Pumps and compressors
- Fans and blowers
- Gearboxes and transmissions
- Turbines
- CNC machine spindles
- Any industrial system with moving or rotating components
Three Main Approaches:
Most vibration programs use one or more of these three strategies, often selecting based on how critical an asset is to production:
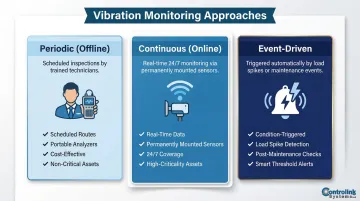
- Periodic (offline, route-based): Technicians walk a defined route on a set schedule, collecting data manually with portable analyzers — cost-effective for non-critical assets
- Continuous (online/IIoT sensors): Permanently mounted sensors stream real-time data around the clock, flagging changes the moment they appear — best suited for high-criticality or hard-to-access equipment
- Event-driven analysis: Measurements triggered by a specific condition — a load spike, a temperature threshold, or a post-maintenance verification — rather than a fixed schedule
Why Vibration Analysis Is Critical in Manufacturing
Manufacturing operations depend on equipment uptime. Vibration analysis is the most reliable early-warning system available—catching faults months before they reach failure severity, giving teams time to plan repairs without disrupting production.
From Reactive to Predictive Maintenance
The shift from reactive "run-to-failure" maintenance to predictive maintenance has changed how plants manage equipment health. Vibration analysis is the technical backbone of that transition. It provides the objective, data-driven evidence needed to act at the right time, not too early and not too late.
Implementing predictive maintenance programs reduces overall maintenance costs from $18 per horsepower per year (reactive approach) to just $9 per horsepower per year—a 50% reduction while eliminating 70-75% of unexpected breakdowns.
Core Operational Benefits
- Reduces unplanned downtime by identifying faults during early development stages
- Lowers maintenance and repair costs by enabling planned interventions instead of emergency responses
- Extends asset lifespan by preventing cascade failures that damage multiple components
- Improves plant safety by flagging dangerous vibration levels before catastrophic failure occurs
- Supports maintenance budgeting with data-backed lead time for parts procurement and scheduling
- Enhances product quality by ensuring machines operate within specified tolerances
A planned bearing replacement costs $500–$2,000 in parts and labor during a scheduled window. The same failure in reactive mode often destroys secondary components—shafts, housings, couplings—multiplying repair costs to $50,000+ and stretching downtime from hours to weeks.
How Vibration Analysis Works — Step by Step
Vibration analysis works best as a structured, repeatable process. Without a baseline or a defined response protocol, collected data rarely translates into actionable maintenance decisions.
Step 1 – Define Critical Assets and Objectives
Start with an asset hierarchy review—identifying which machines are most critical to production continuity and safety, and therefore deserve priority monitoring coverage.
Before data collection begins:
- Define what "normal" looks like for each asset (baseline vibration signature)
- Set alert thresholds based on manufacturer specs and industry standards
- Document operating conditions (load, speed, temperature ranges)
- Prioritize assets based on failure consequence and replacement cost
Step 2 – Select the Right Sensors and Measurement Parameters
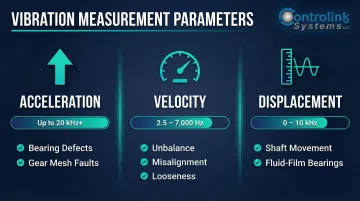
Three core measurement parameters drive fault detection:
| Parameter | Best For | Frequency Range | Typical Application |
|---|---|---|---|
| Acceleration | Early-stage, high-frequency faults | Up to 20 kHz+ | Bearing defects, gear mesh faults, high-frequency impacts |
| Velocity | General fault severity assessment | 2.5 - 7,000 Hz | Unbalance, misalignment, looseness, overall machine health |
| Displacement | Low-frequency faults | 0 - 10 kHz | Shaft movement, fluid-film bearings, loose components |
Sensor Types:
- Accelerometers (most common): piezoelectric sensors with a wide frequency range, best for early-stage bearing and gear fault detection
- Velocity sensors: suited for overall severity assessment across mid-range frequencies
- Proximity/displacement probes: measure shaft movement in fluid-film bearings where oil dampens housing vibration
Sensor mounting method directly affects data quality. Stud mounting provides the widest frequency response (up to 20 kHz+), while magnetic mounts cut off frequencies above 1-3 kHz — masking early-stage bearing faults before they're detected.
Step 3 – Collect and Record Vibration Data
Offline (Periodic) vs. Online (Continuous):
- Offline monitoring: Technician performs route-based measurements on a scheduled basis using portable analyzers—suitable for non-critical assets
- Online monitoring: Continuously mounted IIoT sensors collect real-time data automatically—preferred for critical assets where downtime costs exceed $10,000/hour
Measurement Consistency Is Critical:
To ensure reliable trend data over time:
- Take readings from the same location every time
- Measure in the same axis (radial, axial, tangential)
- Collect data under the same operating conditions (load and speed)
- Document any changes to operating parameters
Step 4 – Apply Signal Analysis (Time Waveform and FFT)
Two primary analysis methods reveal different fault characteristics:
Time Waveform Analysis:
- Shows vibration intensity over time
- Reveals impact events or amplitude spikes
- Identifies intermittent problems
- Useful for detecting looseness and bearing cage defects
Fast Fourier Transform (FFT) Spectrum Analysis:
- Converts the waveform into the frequency domain
- Identifies which specific components are generating elevated vibration
- Shows at what frequencies problems occur
- Enables precise fault diagnosis
Key Frequency Patterns:
- Synchronous peaks (1X, 2X, 3X RPM): reflect rotational patterns — normal or fault-related
- Asynchronous peaks: point to specific fault types like gear mesh issues, bearing defects, or fluid turbulence
- Sub-synchronous peaks: often indicate oil whirl, bearing cage defects, or belt problems
Step 5 – Interpret Results and Determine Fault Severity
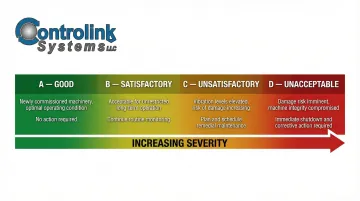
Analysts compare current vibration signatures against the established baseline and against industry severity standards. The ISO 20816-3:2022 standard (which supersedes the outdated ISO 10816-3) classifies fault severity for machines above 15 kW operating between 120 and 30,000 RPM:
- Zone A (Good): Optimal condition, typical for newly commissioned machines
- Zone B (Satisfactory): Suitable for unrestricted, long-term operation
- Zone C (Unsatisfactory): Not suitable for continuous operation; plan remedial action
- Zone D (Unacceptable): Vibration severe enough to cause damage; immediate action required
Don't treat vibration data in isolation. Experienced analysts cross-reference vibration findings with temperature, lubrication condition, operating load, and maintenance history — a flag on a chart only becomes a diagnosis when that context is available.
Step 6 – Act, Document, and Close the Loop
The final step is taking maintenance action based on the diagnosis:
- Schedule repair during planned production window
- Replace degraded component before failure
- Correct alignment or balance issues
- Adjust operating parameters if needed
After the intervention:
- Re-measure to confirm the fault has been resolved
- Verify the machine has returned to a healthy vibration signature
- Log data from each cycle to build long-term condition trends
- Update baseline if machine configuration changed
Each completed cycle adds resolution to your condition model — making the next fault easier to catch earlier and cheaper to fix.
Vibration Analysis in Action: A Real-World Example
A production motor driving a pump system begins showing elevated overall vibration levels during a routine monitoring sweep. Here's how the team applies the process:
Initial Detection:
- Portable analyzer shows overall velocity increased from 0.15 in/sec (baseline) to 0.45 in/sec (Zone C - unsatisfactory)
- No visible damage or unusual noise reported by operators
Time Waveform Analysis:
- Reveals periodic impact events every 0.08 seconds
- Pattern suggests repetitive defect, not random looseness
FFT Spectrum Analysis:
- Elevated frequency peak at 187 Hz—doesn't match shaft speed (1X = 29.5 Hz at 1770 RPM)
- Peak corresponds to bearing characteristic frequency for inner race defect
- Cross-reference with lubrication records shows bearing is 18 months past recommended relubrication interval
Diagnosis: Early-stage inner race bearing fault, caused by inadequate lubrication and surface micro-spalling.
Action Taken:
- Bearing replacement scheduled during planned production window (3 weeks out)
- Replacement cost: $1,200 (bearing + labor)
- No production interruption
What Would Have Happened Without Vibration Analysis:
- Bearing fails catastrophically during production run
- Inner race fragments damage motor shaft and coupling
- Emergency repair cost: $18,000+ (motor shaft machining, coupling replacement, extended labor)
- Production downtime: 36-48 hours
- Lost production value: $50,000+
Key Lesson:
A $1,200 planned repair prevented over $68,000 in combined repair costs and lost production. The event data was also logged to refine the asset's baseline profile — making the next monitoring cycle more accurate than the last.
How Controlink Systems Can Help
Since 1998, Controlink Systems LLC has been developing custom process monitoring and vibration analysis solutions for manufacturers who require systems built around their specific equipment, environment, and production workflows. Using NI (National Instruments) hardware and software, Controlink has deep expertise in integrating these systems into CNC machining environments, shop-floor automation, and end-of-line testing workflows.
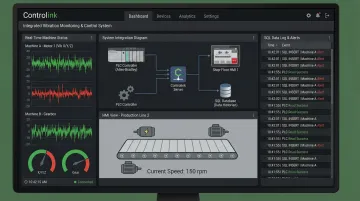
Most vibration monitoring systems operate as standalone tools, disconnected from the production systems that actually act on the data. Controlink bridges that gap by connecting vibration monitoring directly to PLCs, SQL databases, motion controllers, and shop-floor HMIs — turning raw measurements into information your team can use without leaving existing workflows. That integration enables:
- Automatic work order generation when fault thresholds are exceeded
- Real-time vibration data displayed on existing HMI screens
- Vibration trend data stored in your SQL database alongside production metrics
- Coordinated machine shutdown when dangerous vibration levels are detected
Controlink serves CNC machine shops, automotive manufacturers, and industrial equipment producers across the United States — particularly operations where vibration monitoring needs to work within, not alongside, existing control infrastructure.
Get in Touch:
Contact Controlink to discuss how a custom vibration analysis and process monitoring solution can be designed for your specific equipment, environment, and production requirements. Call (800) 838-3479 or visit www.controlinksystems.com.
Frequently Asked Questions
What is vibration analysis used for in manufacturing?
Vibration analysis is used to identify early signs of wear, imbalance, misalignment, and component degradation in rotating machinery—allowing maintenance teams to intervene before faults cause unplanned downtime, safety incidents, or product quality failures.
What are the three main parameters measured in vibration analysis?
The three core parameters are:
- Acceleration — most sensitive for early high-frequency faults like bearing defects
- Velocity — preferred for overall fault severity across mid-range frequencies
- Displacement — used for low-frequency analysis and detecting loose components or shaft movement in fluid-film bearings
What types of sensors are used for vibration analysis?
The three main sensor types are:
- Accelerometers — the most common; piezoelectric-based with a wide frequency range
- Velocity/seismic sensors — suited for lower-frequency overall severity measurements
- Proximity/displacement probes — used for shaft relative displacement in fluid-film bearing machines
Sensor choice depends on asset type and target frequency range.
What common machine faults can vibration analysis detect?
The four most common fault categories are shaft unbalance, shaft misalignment, bearing degradation, and mechanical looseness. Advanced spectrum analysis can detect dozens of additional fault types including gear mesh defects, pump cavitation, and electrical faults in motors.
What is the difference between online and offline vibration monitoring?
Online monitoring uses continuously mounted IIoT sensors to collect real-time data automatically without technician presence. Offline monitoring relies on technicians performing periodic manual measurements on a scheduled route. Online monitoring is preferred for critical assets; offline is suitable for less critical equipment.
How does vibration analysis fit into a predictive maintenance program?
Vibration analysis is the technical foundation of most predictive maintenance programs. It provides objective, data-driven evidence of developing faults, enabling the shift from time-based or reactive maintenance to condition-based repairs that reduce both over-maintenance and unexpected failures.