Introduction
Unplanned bearing failures carry a staggering financial penalty. According to Siemens' 2024 True Cost of Downtime report, unplanned downtime now costs Fortune 500 manufacturers 11% of their annual revenues—totaling $1.4 trillion. The automotive sector alone loses up to $2.3 million per hour when production lines go dark.
Most bearing failures aren't sudden catastrophes. They result from undetected lubrication breakdown or progressive surface damage that conventional vibration monitoring misses until it's too late.
SKF data shows that of bearings that fail prematurely, roughly one-third die from inadequate lubrication and another third from contamination — problems that go undetected by standard vibration analysis.
Shock pulse monitoring (SPM) addresses this directly by detecting high-frequency elastic waves generated at the bearing contact interface. These waves appear long before vibration signatures become visible. For manufacturers running slow-speed equipment like conveyors, dryer rolls, or compressors below 150 RPM, SPM is often the only reliable early-warning system available.
Key Takeaways
- SPM detects high-frequency pressure waves (~32 kHz) from bearing contact, catching problems months before vibration analysis can
- Two readings—HDc (lubrication condition) and HDm (bearing damage)—give maintenance teams direct, actionable data
- On low-speed equipment, SPM outperforms standard vibration analysis and uses normalized scales across machine types
- Effective programs depend on proper sensor placement, baseline data, consistent intervals, and defined alarm thresholds
- SPM and vibration analysis work best together: SPM targets bearing health, vibration catches imbalance and mechanical faults
What Is Shock Pulse Monitoring and Why It Matters
Shock pulse monitoring is a condition monitoring technique that measures high-frequency elastic waves generated when rolling elements contact raceways in bearings. These waves propagate through metal at roughly 5,000 m/s—the speed of sound in steel—and are fundamentally different from the lower-frequency vibration caused by the same collision. Understanding why requires looking at what actually happens the moment metal meets metal.
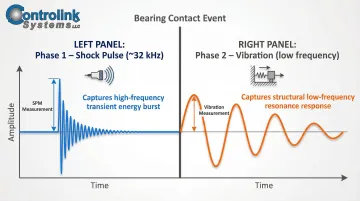
The Two Phases of Metal-to-Metal Contact
When a rolling element strikes a raceway, two distinct phases occur:
- Shock pulse phase — An initial pressure wave at ultrasonic frequencies (~32 kHz) that SPM measures
- Vibration phase — Rebound and flexing at lower frequencies determined by the mass and shape of the bodies, which traditional vibration analysis measures
SPM filters out the vibration phase entirely, isolating only the shock pulse signal. This distinction is critical: the shock pulse reveals what's happening at the microscopic contact interface, while vibration reveals how the entire structure responds.
Why SPM Matters in Manufacturing
SPM directly measures two things vibration analysis cannot detect early:
- Oil film breakdown — metal asperities make direct contact, generating more shock pulses before any vibration signature appears
- Early surface damage — small spalls or cracks produce discrete, high-amplitude shock events that vibration analysis misses entirely
Studies consistently show lubrication failure as a leading cause of bearing damage — and it's invisible to vibration analysis until the damage is already done. This makes SPM particularly critical for:
- Slow-turning equipment (conveyors, dryer rolls)
- Lightly loaded bearings
- Low-speed compressors (below 150 RPM)
- Gearboxes and centrifuges
Beyond Rolling Element Bearings
While SPM was developed for rolling element bearings, it's effective on any equipment with continuous metal-to-metal contact:
- Gearboxes
- Lobe compressors
- Screw compressors
- Centrifuges
- Roller presses and paper mill rolls
Shock Pulse vs. Vibration Analysis: Understanding the Difference
Vibration analysis and shock pulse monitoring are complementary techniques — each built to catch what the other misses.
How Vibration Analysis Works
Vibration analysis monitors lower-frequency signals (typically below 2–10 kHz) produced by mass movement. It's highly effective for diagnosing:
- Imbalance
- Misalignment
- Looseness
- Gear mesh issues
The masking problem: In a typical vibration time signal, 99% of the signal is dominated by rotational forces. This makes it extremely difficult to isolate the comparatively weak signals from early-stage bearing damage, especially at low speeds.
How SPM Overcomes the Masking Problem
The shock pulse transducer is mechanically and electrically tuned to resonate at precisely 32 kHz. It responds strongly to elastic waves while rejecting low-frequency vibration noise.
Unlike vibration enveloping techniques, which rely on the natural structural resonance of the machine and vary by machine, the SPM "ringing structure" is fixed at 32 kHz and built directly into the transducer.
Key advantage: You don't need to hunt for the "haystack" resonance frequency in each machine's spectrum. The 32 kHz resonance is consistent and calibrated across all SPM transducers.
The Critical Low-Speed Advantage
At low RPMs (below 100–150 RPM), the mechanical signal energy from a deteriorating bearing is so weak that vibration analysis frequently misses early-stage damage. SPM has proven effective on twin-wire presses operating at just 7–16 RPM, providing 6 to 14 months of pre-warning before failure.
The Normalization Factor: dBi or HDi
SPM calculates a normalization value using measured RPM and bearing diameter, which is subtracted from the raw shock pulse reading to produce a normalized scale (dBn). Alarm thresholds can then be set in absolute terms — for example, alert at 21 dB normalized, alarm at 35 dB — without machine-specific calibration.
Vibration enveloping can't use absolute amplitude values reliably because structural resonances vary by machine. SPM's normalization creates a universal scale that travels across assets.
When to Use Each Technique
| Technique | Best For | Limitations |
|---|---|---|
| SPM | Bearing lubrication monitoring, early bearing damage, low-speed assets (<150 RPM) | Requires dedicated transducers; not for diagnosing imbalance or misalignment |
| Vibration Analysis | Imbalance, misalignment, resonance, gear mesh, looseness | Weak signal from early bearing damage; ineffective below 100 RPM |
Best practice: Use both techniques together for full-spectrum machine health monitoring.
How Shock Pulse Monitoring Works: Inside the Method
The Shock Pulse Transducer Design
The SPM transducer contains a piezoelectric crystal element tuned to resonate at 32 kHz. When an elastic wave from a bearing contact event reaches the transducer, it causes a damped oscillation at its resonance frequency.
Critical design feature: The oscillation must decay completely before the next pulse arrives — overlapping pulses create false readings. All calibrated SPM transducers are designed to respond identically to a given elastic wave, enabling absolute measurements across different machines and installations.
Three-Stage Signal Processing
- Amplification — The transducer's piezo stack boosts the small 32 kHz shock signal for downstream processing.
- Band-pass filtering — A filter centered at 32 kHz strips out lower-frequency machine vibration, isolating the shock signal.
- Conversion — The filtered waveform is converted from a continuous signal into discrete analog pulses representing individual shock events.
The Two Primary Output Values
Because the dynamic range of bearing shocks is massive (a damaged bearing can produce shocks 1,000 times stronger than a healthy one), values are expressed on a logarithmic decibel scale.
HDc (Carpet Value) tracks the threshold level at which 200 shock pulses per second are present — the background noise floor from metal-to-metal contact. When the lubrication film breaks down, HDc rises because more surface asperities make contact.
HDm (Max Value) captures the highest shock pulse amplitude during the measurement window. A periodically elevated HDm points to a discrete defect — such as a spall on the outer raceway — being struck by a rolling element on each rotation.
Delta (HDm − HDc) is the key diagnostic ratio between those two values:
- Large delta with elevated HDm = structural damage (discrete defect present)
- Small delta with high overall values = dry running (widespread metal-to-metal contact)
- Small delta with low overall values = healthy bearing, adequate lubrication
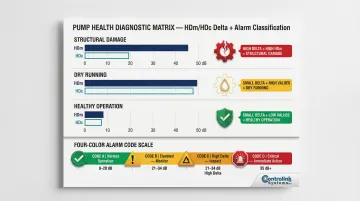
Color-Coded Alarm System
| Code | Normalized Threshold | Meaning |
|---|---|---|
| Green (Code A) | 0 to 20 dB | Good bearing, adequate lubrication |
| Yellow (Code B) | 21 to 34 dB | Good bearing but lubrication needs attention |
| Yellow (Code C) | 21 to 34 dB (high delta) | Early bearing damage |
| Red (Code D) | 35 dB and above | Significant bearing damage requiring replacement planning |
These alarm codes assume consistent measurement conditions. Critical threshold: A Code D reading with a rapidly increasing condition number — or a normalized value above ~45 dB — warrants immediate intervention.
Variable Speed Handling
As shaft RPM increases, shock pulse density and amplitude naturally rise. Without compensation, those shifts make alarm thresholds unreliable across different operating speeds.
Normalization resolves this. The user provides three inputs:
- Bearing diameter
- Shaft RPM (entered manually or via live sensor feed)
- Measurement window duration
The meter calculates a normalization factor automatically, producing readings that are directly comparable across different machines, speeds, and bearing sizes.
Implementing a Shock Pulse Monitoring Program: Step by Step
Before collecting any data, identify all critical rotating assets and prepare each measurement point. Proper setup ensures the readings you collect are actually usable.
Pre-measurement checklist:
- Mount adapters as close as possible to the loaded zone of each bearing housing
- Establish a solid, direct mechanical path between the bearing outer race and the transducer (avoid joints, cavities, or porous housing materials that attenuate signals)
- Record bearing nameplate data: bearing number, shaft diameter, and RPM
With setup confirmed, work through the following five steps in sequence.
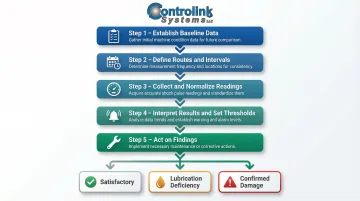
Step 1 – Establish Baseline Data
Collect initial readings on all monitored bearings while equipment is known to be in acceptable condition. Record:
- Bearing condition codes
- HDm (max value)
- HDc (carpet value)
- LUB number for each point
Initial readings serve as the individual machine reference baseline, enabling future trend comparisons. Establish lubrication practices at this stage and verify that lubricant type is consistent and compatible across all bearings on the asset.
Step 2 – Define Routes and Measurement Intervals
Build a structured measurement route covering all monitored assets. Define collection frequency based on:
- Equipment criticality
- Operating environment
- Current condition
Example intervals:
- Critical unspared equipment: Weekly or bi-weekly
- Standard production equipment: Monthly
- Non-critical equipment: Quarterly
Consistency is essential: Use the same measurement location, contact force, and technique every time for reliable trending.
Step 3 – Collect Data and Normalize Readings
During each route:
- Input the correct bearing diameter and RPM into the measurement device before taking readings
- Collect readings in the same location each time
- Verify the normalization factor is applied correctly
Common mistake: Collecting data without entering bearing parameters produces raw dBsv values that cannot be compared across time or equipment.
Step 4 – Interpret Results and Set Alarm Thresholds
Apply standardized alarm levels to the normalized HDm and HDc values:
Typical thresholds:
- Alert: 21 dB normalized
- Alarm: 35 dB normalized
Low-speed applications: Use higher thresholds (35/45 dB) given the longer survivability of damaged bearings at low RPM.
Once thresholds are set, readings above alert level require an immediate response protocol.
When Code C or D readings appear:
- Shorten the monitoring interval
- Monitor the condition number trend rate
- Use the lubrication test protocol (regrease and re-measure) to distinguish lubrication-driven readings from structural bearing damage
Step 5 – Act on Findings and Close the Loop
SPM readings translate directly into three maintenance decisions:
- Satisfactory condition: No action required — continue monitoring on the established schedule
- Lubrication deficiency: Correct grease type, quantity, or frequency, then verify improvement at the next reading
- Confirmed bearing damage: Schedule replacement at the appropriate intervention window based on trend rate and current condition number
Integrate SPM findings into your CMMS and track saves vs. failures. That data is what justifies the program budget and secures ongoing management support.
How Controlink Systems Can Help
When bearing failures go undetected, the costs compound fast—unplanned downtime, scrapped parts, and emergency maintenance calls. Controlink Systems LLC has spent over 25 years solving exactly this problem. As an NI Partner since 2000, Controlink specializes in linking disparate shop-floor systems together, combining vibration analysis, high-speed process monitoring, and production data into unified monitoring architectures.
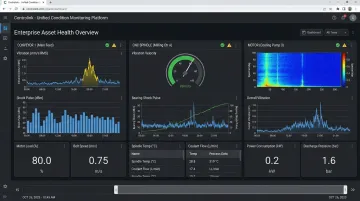
Integrated Condition Monitoring Architecture
Controlink's solutions eliminate the need for disconnected, manual tools by combining:
- Shock pulse data
- Vibration signals
- Production process data
The result is continuous, automated bearing health visibility across CNC machines, conveyor systems, motors, fans, and other critical rotating equipment, all managed within a single monitoring platform.
Tailored to Your Environment
Controlink configures condition monitoring to match your actual equipment—not a generic template. Support spans a wide operating range:
- Low-speed conveyors: down to 15 RPM where traditional vibration analysis struggles
- High-speed spindles: up to 10,000 RPM in CNC machining environments
- Mixed fleets: multiple machine types within a single unified platform
This flexibility means the system fits your maintenance program as it is today, with room to expand as your monitoring needs grow.
Get started: Contact Controlink at (800) 838-3479 or support@controlinksystems.com to discuss how their shop-floor monitoring solutions can be tailored to your specific equipment and maintenance program needs.
Frequently Asked Questions
What is the difference between shock pulse measurement and vibration analysis?
Shock pulse measurement detects high-frequency elastic waves (~32 kHz) generated at the bearing contact interface, providing direct lubrication and bearing damage data. Vibration analysis monitors lower-frequency mass movement useful for imbalance, misalignment, and gear mesh. The two techniques are complementary—not competing alternatives.
What is shock pulse in vibration?
A shock pulse is not vibration. It's the first phase of a metal-to-metal collision: a transient elastic pressure wave that propagates through rigid material at the speed of sound. Vibration is the second phase (structural rebound and flexing). SPM specifically filters out vibration to isolate the shock pulse signal.
What is dBi, dBm, and dBc in SPM?
Each value measures a distinct condition:
- dBi (HDi): Normalization index derived from bearing diameter and RPM, adjusting raw readings to a standardized scale
- dBm (HDm): Peak shock pulse amplitude during the measurement window, indicating bearing damage severity
- dBc (HDc): Carpet value—the level where 200 shocks per second occur—indicating lubrication condition
What equipment can be monitored using the shock pulse method?
While SPM was developed for rolling element bearings, it's effective on any equipment with continuous metal-to-metal contact—including gearboxes, lobe and screw compressors, centrifuges, conveyor bearings, motors, fans, and pumps.
How often should shock pulse measurements be taken?
Measurement frequency depends on equipment criticality, operating speed, and current condition. Critical unspared equipment or assets showing Code C/D readings should be measured more frequently. Once damage is confirmed, shorten the interval and track the condition number trend rate to estimate the replacement window.
Can shock pulse monitoring detect lubrication problems before bearing damage occurs?
Yes. Detecting lubrication degradation before surface damage occurs is one of SPM's primary strengths. As the oil film breaks down, the HDc/carpet value rises from increased asperity contact—giving maintenance teams time to intervene before the HDm/bearing damage value starts to climb.