This scenario plays out daily in CNC machine shops and manufacturing facilities across the country. The root cause isn't a lack of effort—it's a lack of visibility. Production monitoring solves this problem by giving you a real-time, data-driven view of what's actually happening on your shop floor, so you can catch issues as they occur rather than discovering them when it's too late.
This guide walks you through what production monitoring is, why it matters, what to track, the types of systems available, and how to implement one effectively in a CNC machining or precision manufacturing environment.
Who This Guide Is For: CNC machine shops, stamping plants, precision manufacturers, and any facility where understanding what's happening on the shop floor in real time is critical to quality, output, and profitability.
Key Takeaways
- Continuous data collection from machines, processes, and operators drives efficiency, quality, and uptime improvements
- Key metrics include OEE, throughput, downtime (planned vs. unplanned), cycle time, and scrap/rework rates
- Monitoring systems span manual tracking to automated platforms connected to PLCs, sensors, and CNC communications
- Effective implementation starts with clear goals, the right system for your facility, and a team that acts on the data
- AI-driven predictive analytics, digital twins, and IIoT connectivity are shaping where production monitoring goes next
What Is Production Monitoring?
Production monitoring is a continuous process of observing, collecting, and analyzing data from manufacturing operations. It covers machines, production lines, process parameters, quality outputs, and more—giving plant managers and engineers a live view of exactly what's happening on the shop floor.
Scope of What Can Be Monitored
The scope depends on your goals, but typical data points include:
- Machine uptime and downtime (planned and unplanned)
- Cycle times (actual time to complete one unit)
- Process variables such as temperature, pressure, spindle speed, and vibration
- Product quality metrics including scrap rates, rework, and first-pass yield
- Material usage and waste
- Labor efficiency and operator activity
- Energy consumption across equipment
How Production Monitoring Differs from Inspection
Inspection is periodic and checks conformance at a point in time. Production monitoring is continuous and designed to detect trends, catch issues early, and drive ongoing improvement. While inspection answers "Did this part pass?" monitoring answers "Why are we producing defects, and how do we stop it?"
It's also distinct from machine monitoring, which focuses on individual equipment health. Production monitoring takes a broader view—tracking overall production flow and how machines, operators, processes, and materials interact to deliver output.
Why Production Monitoring Matters
Without visibility into what is actually happening on the floor, manufacturers are left reacting to problems after they've already caused scrap, downtime, or missed deadlines. This creates what industry experts call "hidden losses"—inefficiencies that don't show up in total output numbers but erode capacity, quality, and profitability over time.
The Cost of Unplanned Downtime
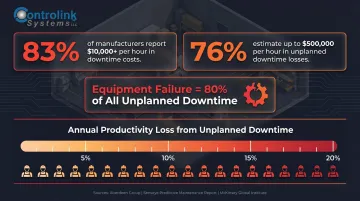
83% of industrial decision-makers report unplanned downtime costs a minimum of $10,000 per hour, with 76% estimating up to $500,000 per hour—and for 7%, the figure exceeds that threshold. Equipment failure accounts for 80% of all unplanned downtime in manufacturing, and the average plant loses 5-20% of its annual productivity to these stoppages.
Real-time monitoring allows operators and supervisors to catch machine stoppages, slowdowns, and quality deviations as they happen rather than discovering them at shift end. That visibility shifts maintenance from reactive repairs to proactive intervention, cutting both the frequency and duration of unplanned stops.
Quality and Scrap Reduction
Monitoring process variables and quality metrics in real time allows teams to identify when a process is drifting out of spec before an entire batch is ruined. The American Society for Quality (ASQ) estimates Cost of Poor Quality (COPQ) at 5-30% of annual revenue—meaning a $100 million manufacturer could be losing $5-30 million annually to scrap, rework, warranty claims, and lost business.
One underappreciated quality lever is program version control. Ensuring machinists always run the latest engineering-approved files—through DNC communications integrated with monitoring systems—directly reduces scrap from preventable setup errors. Controlink Systems builds exactly this kind of connection: linking program version control to real-time machine status so shops can catch outdated files before they produce bad parts.
Strategic and Tactical Value
Standardized production data enables management to:
- Make better investment decisions based on actual utilization and bottleneck analysis
- Compare performance across shifts, lines, or facilities
- Hold teams accountable to targets with objective data
- Identify where capacity constraints are costing the most
Employee Safety and Compliance
Monitoring systems can alert workers to dangerous operating conditions such as pressure exceedances or over-temperature events. They also provide the documentation trail needed for regulatory compliance and audits, ensuring you have verifiable records of process parameters and machine states.
Key Metrics to Track in Production Monitoring
OEE (Overall Equipment Effectiveness)
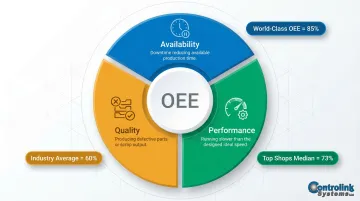
OEE is the most widely used composite metric, combining Availability, Performance, and Quality into a single percentage that reveals how effectively equipment is running. World-class OEE is benchmarked at 85%, established by Seiichi Nakajima in the 1970s based on Japanese automotive manufacturing practices.
Most manufacturers score closer to 60%, with Top Shops (top 20% of CNC machine shops) reporting median OEE of 73% versus 65% for peers. The 20+ point gap between average and world-class OEE represents recoverable capacity already installed on your shop floor.
Breaking OEE down into components allows teams to pinpoint whether losses are coming from:
- Availability (downtime reducing available production time)
- Performance (running slower than designed speed)
- Quality (producing defects or scrap)
Throughput and Production Rate
Throughput is the number of good units produced over a given time period. Monitoring throughput in real time lets supervisors catch output dips mid-shift and trace them to specific causes before the day's targets are missed.
Downtime (Planned vs. Unplanned)
Distinguishing between planned and unplanned downtime matters for prioritizing improvement efforts. Logging downtime reasons—whether through operator input or automatic machine state detection—turns downtime from a vague problem into a categorized, actionable list of root causes.
How you categorize downtime also shapes your maintenance strategy. 71% of maintenance professionals use preventive maintenance, but 38% still rely on reactive/run-to-failure approaches. Only 27% use predictive maintenance — which McKinsey research links to 18-25% maintenance cost reductions and 30-50% fewer unplanned stoppages.
Cycle Time vs. Takt Time
- Cycle time is the actual time to complete one unit
- Takt time is the rate needed to meet customer demand
The gap between the two reveals where waste, overproduction, or bottlenecks exist. Real-time monitoring allows this comparison to be made continuously rather than only during audits.
Scrap, Rework, and First-Pass Yield
Tracking defects and rework rates as production runs gives a live signal when something is going wrong—a tooling issue, an out-of-spec material, or a parameter drift. First-pass yield (FPY) is particularly valuable in precision machining environments where rework is costly and traceability is required.
World-class FPY is 95% or above. FPY below 90% signals significant stability issues requiring immediate investigation.
Condition Monitoring Data
For CNC and machining environments, machine condition data—such as vibration signatures, spindle load, and temperature—adds a critical dimension beyond traditional production KPIs. Vibration analysis can detect early signs of bearing wear, imbalance, or tooling degradation before a machine failure interrupts production.
High-precision facilities — aerospace, automotive, medical — have little tolerance for unexpected breakdowns, making condition monitoring a core part of the production monitoring stack rather than an optional add-on. Controlink Systems builds process monitoring and vibration analysis systems specifically for these environments, with installations across CNC machine shops, automotive lines, and aerospace facilities since 1998.
Types of Production Monitoring Systems
Real-Time Automated Monitoring Systems
These systems continuously pull data from PLCs, IoT sensors, and edge devices to provide live dashboards and automated alerts. Advantages include immediate visibility and faster response. They support short interval control—reviewing data hourly or per shift—for rapid operational adjustments.
OEE and Performance Monitoring Platforms
Dedicated OEE software automates the collection and calculation of Availability, Performance, and Quality metrics, replacing manual paper logs with reliable, comparable data. These platforms typically include dashboards for operators and reports for managers.
54% of small- and medium-sized plants still use pen, paper, or spreadsheets as their manufacturing execution system. That means the majority of shops are still flying blind — without the consistent data OEE platforms are built to deliver.
Condition Monitoring and Vibration Analysis Systems
This specialized category focuses on monitoring the health of individual machines through sensors that track vibration, temperature, acoustic emissions, or spindle load. It drives predictive maintenance programs in high-precision machining environments, allowing maintenance teams to schedule repairs before a failure happens.
For machining environments specifically, vibration analysis integrated with process monitoring can identify bearing degradation months before it causes a spindle failure — catching problems early enough to schedule a planned repair rather than scramble through an unplanned outage.
SCADA and MES Platforms
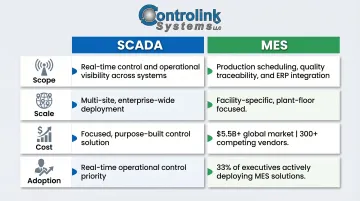
SCADA (Supervisory Control and Data Acquisition) systems are centralized monitoring frameworks suited for large-scale or multi-site facilities. Manufacturing Execution Systems (MES) are broader platforms that connect production monitoring with scheduling, traceability, work orders, and ERP data.
Both offer comprehensive coverage, but that comes with added complexity and implementation cost. Key trade-offs to weigh:
- Scope: MES connects monitoring to scheduling, traceability, and ERP — SCADA focuses on control and visibility
- Scale: SCADA scales well across multiple sites; MES is typically facility-specific
- Cost: The MES market tops $5.5 billion with 300+ vendors — pricing and capability vary widely
- Adoption: 33% of manufacturing executives are actively deploying execution systems right now
Cloud-Based vs. On-Premises Systems
The deployment model shapes long-term cost, control, and flexibility:
- Cloud systems: Lower upfront hardware costs, remote access, easier to scale — good fit for multi-site visibility
- On-premises systems: Greater data control, preferred in high-security or regulated environments such as aerospace and defense
Your IT infrastructure, data sensitivity requirements, and growth trajectory should drive this decision.
How to Implement a Production Monitoring System
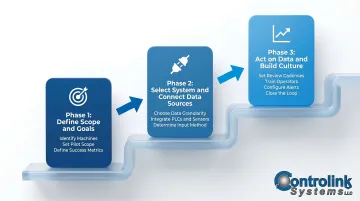
Phase 1 — Define Scope and Goals
Start by identifying the specific problem you're trying to solve: unexplained downtime, rising scrap rates, poor machine utilization. From there, narrow your focus:
- Identify which machines or lines contribute most to the problem
- Start with a focused pilot on one critical machine rather than a plant-wide rollout
- Define which metrics will be tracked and what "success" looks like before selecting any technology
Phase 2 — Select a System and Connect Data Sources
Key decisions at this stage:
- What level of data granularity is needed?
- How will the monitoring system integrate with existing equipment (PLCs, CNC controllers, sensors, ERP/DNC software)?
- Will you use manual operator input, automated sensors, or a hybrid approach as the primary data source?
In CNC shop environments, the integration question extends further. Connecting your monitoring system with DNC communication software means program version control and machine status flow through a single architecture — eliminating the blind spots that separate systems create. Controlink Systems LLC builds exactly these kinds of integrated setups, linking DNC file management with real-time process monitoring so shops get a unified view of what's running, and what's not.
Phase 3 — Act on Data and Build a Culture of Improvement
The system goes live — but that's where the real work starts. Lasting improvements come from:
- Establishing regular review cadences (daily shift reviews, weekly trend analysis)
- Training operators to trust and use the data
- Configuring alerts that trigger timely responses
- Committing to closing the loop—taking corrective action, tracking results, and refining the process continuously
Best Practices and Common Challenges
Key Best Practices
- Standardize metric definitions across shifts and lines before rollout (so "downtime" means the same thing to every supervisor)
- Involve operators early in the process to build buy-in rather than resistance
- Configure dashboards for the right audience—operators need real-time line status, managers need trend reports
- Avoid collecting data without a defined process for acting on it
Common Challenges
- Data silos from legacy equipment: bridge old and new systems using open APIs or IoT gateways
- Inaccurate data from manual entry or uncalibrated sensors: automate data capture and schedule regular sensor calibration
- Low operator engagement: give floor staff real-time dashboards, let them tag downtime causes, and show how the data improves their own work—not just management's reports
The Future of Production Monitoring
Production monitoring is evolving fast. Three technologies are driving the next wave:
AI and machine learning enable predictive analytics that flag issues before they cause failures. 32% of maintenance teams have implemented AI, and 65% expect to adopt AI within 12 months.
Digital twins allow teams to simulate process changes virtually before applying them to the actual line. PepsiCo's collaboration with Siemens and NVIDIA delivered a 20% throughput increase and identified up to 90% of potential issues before physical modifications.
Expanded IIoT connectivity brings more machines—including legacy equipment retrofitted with smart sensors—into the monitoring network. 46% of manufacturers now use Industrial IoT solutions, creating the data foundation for advanced analytics.
Frequently Asked Questions
What is production monitoring?
Production monitoring is the continuous collection and analysis of data from manufacturing operations—machines, processes, quality outputs, and labor—to improve efficiency, reduce downtime, and maintain product quality in real time.
What are the main types of production monitoring?
The main types are real-time automated systems, OEE/performance monitoring platforms, condition monitoring, and SCADA and MES systems. Which type fits best depends on your operation's complexity, existing infrastructure, and monitoring goals.
What tools are used for production monitoring?
Common tools include IoT sensors and edge devices, PLC integrations, production monitoring and OEE software, data visualization dashboards, DNC/CNC communication systems, and manual input terminals for operator-entered data.
Which systems provide real-time monitoring of production activities?
SCADA systems, IIoT-connected sensor networks, and OEE platforms with live dashboards all deliver real-time visibility. The most effective systems pull data directly from machine controllers and feed it into your existing business software without manual intervention.
What are the key elements of condition monitoring?
Condition monitoring tracks machine health through vibration analysis, temperature monitoring, acoustic emission detection, and spindle load tracking. These signals reveal wear or degradation early enough to schedule maintenance before an unplanned stoppage occurs.
How do you monitor the production process?
Start by connecting data sources—sensors, PLCs, and operator terminals—and transmitting that data to a centralized system. From there, analyze it against targets and historical baselines, visualize it through dashboards, and act on findings through regular review meetings and corrective actions.