Introduction
Machines rarely fail without warning—the problem is most manufacturers don't have the systems in place to catch the signs early. Unplanned downtime costs U.S. manufacturers an estimated $50 billion annually, with average hourly losses reaching $260,000 across manufacturing sectors.
In highly integrated industries like automotive, that figure reaches $2.3 million per hour. Equipment failure alone accounts for 42% of all unplanned production stops. For CNC shops and manufacturers, machine performance monitoring isn't optional — it's the difference between catching a problem on Tuesday and explaining a production halt on Wednesday.
This guide breaks down what machine performance monitoring is, which metrics actually move the needle, the technologies behind it, and a practical implementation roadmap built for shop-floor realities.
Key Takeaways
- Machine performance monitoring continuously tracks equipment health, behavior, and output to reduce unplanned downtime and catch quality issues early
- Track OEE, cycle time, downtime events, utilization rate, vibration, and energy use
- Benefits include 30-50% reductions in unplanned downtime, extended equipment life, and scrap cuts up to 50%
- Start with a machine connectivity audit, pick your most critical asset to pilot, and build your metric baseline from there
What Is Machine Performance Monitoring?
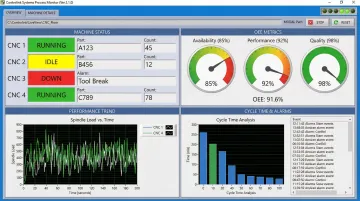
Machine performance monitoring is the use of sensors, software, and real-time dashboards to continuously track the health, behavior, and output of industrial equipment. Unlike visual inspections or scheduled maintenance checks that provide periodic snapshots, monitoring systems deliver constant visibility into machine status, run rates, cycle times, energy consumption, vibration levels, and temperature, all fed into a centralized platform for analysis.
This continuous data collection changes how shops operate. Instead of discovering problems during post-production inspection or after a catastrophic failure, operators get early warnings when conditions drift from normal parameters. A CNC machine showing gradual spindle vibration increases or thermal readings outside expected ranges can be flagged for intervention before a bearing fails or tolerances are compromised.
The data types collected typically include:
- Machine status: On/off state, run rate, speed, idle time
- Downtime events: Duration, frequency, cause codes
- Cycle metrics: Actual vs. target cycle time, throughput
- Physical conditions: Vibration amplitude, temperature, spindle load, current draw
- Energy data: Power consumption, efficiency trends
These data streams point in two directions: the physical health of the equipment and the operational output it delivers. That distinction matters when building a monitoring strategy.
Condition Monitoring vs. Performance Monitoring
Condition monitoring focuses narrowly on the physical health of a machine, tracking vibration signatures, thermal patterns, lubrication quality, and other indicators of mechanical deterioration. Its goal is to detect component degradation before failure occurs.
Performance monitoring takes a broader operational view, measuring throughput, Overall Equipment Effectiveness (OEE), cycle efficiency, and utilization rates. It answers questions like "Is this machine producing at expected rates?" and "Where is production time being lost?"
A complete monitoring strategy combines both. Condition data catches the bearing wear that threatens a breakdown; performance data reveals that the same machine is running 15% below capacity due to excessive setup times. Both findings are critical — they just require different responses.
Key Metrics to Track for Machine Performance
Overall Equipment Effectiveness (OEE)
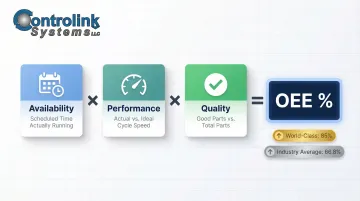
OEE is the gold-standard metric that combines Availability, Performance, and Quality into a single percentage. It measures the percentage of planned production time that is truly productive.
The three components:
- Availability: Percentage of scheduled time the machine is actually running (accounting for downtime)
- Performance: Actual production speed compared to ideal cycle time (catching slowdowns)
- Quality: Percentage of parts produced that meet specifications (no rework or scrap)
Many manufacturers cite 85% as world-class OEE, but the average is considerably lower. Discrete manufacturing sits at just 66.8%, and only about 6% of organizations actually reach that 85% threshold.
That gap reveals significant untapped capacity. Improving from 67% to 75% OEE in a facility running three shifts can be equivalent to adding nearly a full production shift—without any capital investment.
OEE provides a more complete picture than uptime alone because a machine can be "running" while producing slowly or generating scrap—both of which OEE captures.
Cycle Time
OEE's Performance component is largely driven by cycle time—the duration required to complete one production cycle from start to finish. In CNC machining, deviations from standard cycle time signal specific problems:
- Longer cycles: Tool wear, incorrect feeds/speeds, programming inefficiencies
- Inconsistent cycles: Operator variability, material inconsistencies, fixturing issues
- Shortened cycles: Potential quality shortcuts, skipped operations
Tracking cycle time variation is especially critical in high-precision environments where consistency directly impacts part quality. A 5% cycle time increase might indicate a dull tool that's also affecting surface finish and dimensional accuracy.
Machine Downtime (Planned vs. Unplanned)
Not all downtime is equal. Planned downtime for scheduled maintenance, changeovers, or breaks is predictable and manageable. Unplanned downtime—breakdowns, material shortages, quality holds—is the productivity killer.
Tracking both types with detailed cause codes enables root-cause analysis. Research shows that unplanned downtime accounts for 34.2% of all OEE losses in discrete manufacturing, followed by setup and changeover at 28.7%. Understanding which specific failure modes or material issues drive your downtime losses focuses improvement efforts where they'll have the greatest impact.
Machine Utilization Rate
Utilization rate measures the percentage of available time a machine is actually running and producing. A machine with high uptime but low utilization might be sitting idle due to poor scheduling, waiting for materials, or lack of work orders.
Identifying underutilized assets helps optimize production scheduling, balance workloads across the shop floor, and make data-driven decisions about capacity investments. A shop discovering that three machines average 45% utilization while one bottleneck machine runs at 95% can redistribute work or justify targeted capacity additions.
Vibration, Temperature, and Condition Data
Physical parameter monitoring catches early signs of mechanical problems before they cause costly failures. In CNC machines, spindle vibration data detects bearing wear, tool chatter, or imbalance, while temperature monitoring flags lubrication failures, excessive friction, or thermal expansion issues affecting tolerances.
These condition metrics matter most in high-precision environments where even minor degradation affects part quality. A vibration spike during a finishing pass may indicate tool wear pushing dimensions out of tolerance—catching it in real-time prevents scrap rather than discovering the problem at final inspection.
Benefits of Machine Performance Monitoring
Reduced Unplanned Downtime
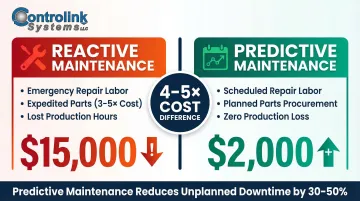
Real-time alerts on anomalous readings allow maintenance teams to intervene before failure occurs, shifting operations from reactive scrambling to proactive prevention. Predictive maintenance reduces unplanned downtime by 30-50% compared to reactive strategies.
The cost difference is stark. Proactive repairs cost 4 to 5 times less than emergency repairs on the same asset, and emergency parts procurement costs 3 to 5 times more than planned purchases. A bearing replacement scheduled during a planned maintenance window might cost $2,000 in parts and labor; the same bearing failing catastrophically during production can cost $15,000 when you factor in emergency overtime, expedited shipping, and lost production.
Predictive Maintenance and Extended Equipment Lifespan
Performance data trends reveal the optimal window for servicing equipment based on actual condition rather than arbitrary calendar schedules. This is critical because 82% of assets display random failure patterns—meaning time-based preventive maintenance is ineffective for most equipment.
By scheduling maintenance when mechanical and operational conditions warrant it, shops avoid both premature interventions (wasting resources on components with remaining useful life) and delayed interventions (allowing degradation to cause secondary damage). This extends overall asset life and reduces total cost of ownership. The U.S. Department of Energy reports that predictive maintenance can eliminate 70-75% of breakdowns.
Improved Product Quality and Scrap Reduction
Detecting performance inconsistencies before they affect part tolerances allows shops to catch quality issues upstream rather than at final inspection. Feed rate drift, temperature variance, or vibration changes can all compromise dimensional accuracy or surface finish—monitoring systems flag these deviations in real time.
That upstream catch translates directly to savings. The Cost of Poor Quality (COPQ) typically consumes 15-20% of total sales revenue for average manufacturers, with some reaching 40%. Real-time monitoring has been shown to reduce scrap rates by up to 50% in discrete manufacturing applications. For a shop producing $5 million in annual sales, reducing COPQ from 18% to 10% represents $400,000 in annual savings.
Data-Driven Decision Making Across the Shop Floor
Centralizing machine data into a single dashboard gives supervisors and managers visibility they previously lacked. Instead of walking the floor to check machine status or relying on operator reports, decision-makers see real-time production status, bottlenecks, and performance trends at a glance.
This visibility enables:
- Assign work to machines with available capacity rather than overloading bottlenecks
- Pinpoint which process step is constraining throughput
- Use utilization and capacity data to justify equipment purchases
- Replace anecdotal discussions with data-driven analysis
Together, these capabilities close the gap between what's happening on the shop floor and what management can act on.
Technologies That Power Machine Performance Monitoring
IoT Sensors and Edge Devices
Sensors mounted on or near machines capture real-time operational data—vibration accelerometers detect bearing wear, thermocouples monitor spindle temperature, current sensors measure motor load. Edge computing devices process this data locally for near-instant responsiveness, filtering noise and triggering immediate alerts before sending aggregated data upstream to centralized systems.
Modern solutions support legacy machines through retrofit sensor kits, removing the need to replace older equipment. A 20-year-old CNC lathe without native connectivity can be equipped with aftermarket sensors and communication hardware to participate in the same monitoring ecosystem as newer machines.
Software Platforms and Dashboards
Monitoring software aggregates machine data from multiple sources, displays it through intuitive dashboards, and generates alerts when conditions exceed thresholds. A good platform connects diverse machines into a single view, making floor-wide status visible without walking the line.
Controlink Systems' process monitoring software is built specifically for machining environments, integrating with NI hardware and supporting protocols like Modbus, Profinet, and EtherCAT to connect both modern and legacy CNC machines. It interfaces with SQL databases and PLC hardware, enabling monitoring architectures that span entire production lines.
Effective dashboards provide role-based views—operators see machine status and immediate alerts, supervisors see line-level performance and downtime patterns, and managers see facility-wide OEE trends and capacity utilization.
AI, Machine Learning, and Predictive Analytics
AI-driven analytics layers identify subtle patterns that precede failures—gradual vibration increases, power draw trends, or temperature drift that human observers might miss. Machine learning models trained on historical data can predict remaining useful life and forecast when specific components are likely to fail.
This moves beyond simple threshold alerts (temperature exceeds 180°F) to true predictive maintenance—where a bearing's expected failure in 7-10 days gets scheduled into the maintenance calendar before production is disrupted.
How to Implement a Machine Performance Monitoring System
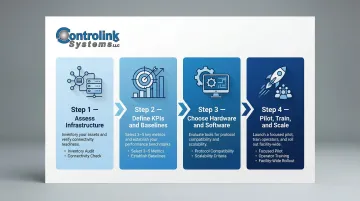
Step 1 — Assess Your Current Infrastructure
Start with a comprehensive machine inventory audit:
- Catalog machine ages and types: CNC mills, lathes, grinders, inspection equipment
- Document communication capabilities: Which machines have OPC-UA, Fanuc FOCAS, MTConnect, or serial interfaces?
- Identify data gaps: What information do you need but can't currently access?
- Evaluate network infrastructure: Is shop-floor Ethernet available? What about wireless coverage?
Older machines without native connectivity may require hardware retrofits—communication adapters, sensor kits, or gateway devices—before software integration is possible. Understanding these requirements upfront prevents surprises during deployment.
Step 2 — Define KPIs and Set Baselines
Select 3-5 meaningful metrics tied to specific operational goals before deployment. Trying to track everything creates noise; focusing on key indicators drives action.
Example goal-based KPIs:
| Goal | KPIs to Track |
|---|---|
| Reduce unplanned downtime by 25% | Unplanned downtime hours, MTBF, downtime by cause code |
| Improve OEE from 68% to 75% | OEE by machine, availability %, performance efficiency, quality rate |
| Cut scrap by 30% | Scrap rate by machine, first-pass yield, quality holds |
Establish baselines for each metric before implementation so you can measure the system's impact objectively. If current OEE is unknown, track it manually for 2-4 weeks to establish a starting point.
Step 3 — Choose the Right Hardware and Software
The ideal solution must be compatible with your machine mix, user-friendly enough for shop-floor operators, and scalable as your facility grows. Key selection criteria include:
- Supports your machines' native protocols (OPC-UA, MTConnect, Fanuc FOCAS, serial)
- Dashboards operators can read and act on without extensive training
- Adds machines incrementally without requiring system redesign
- Connects with existing ERP, MES, or CMMS systems
- Vendor provides responsive support for shop-floor environments
Controlink Systems LLC has been developing shop-floor automation and process monitoring solutions since 1998. As a member of the NI Partner Network since 2000, they specialize in connecting diverse machine types—CNC mills, lathes, inspection equipment—and building integrated monitoring architectures tailored to machining environments.
Step 4 — Pilot, Train, and Scale
Start with a pilot deployment on one critical machine or cell rather than attempting facility-wide rollout immediately. A focused pilot:
- Limits initial risk and investment
- Generates early results that build organizational buy-in
- Surfaces integration challenges in a controlled environment
- Gives operators and supervisors a low-stakes training ground
Use pilot results to refine your approach, then systematically roll out across the facility. Provide hands-on training so operators and managers can act on the data—not just view it. Training should cover:
- How to interpret dashboard displays
- When and how to respond to alerts
- How to log downtime events and cause codes
- How to use data for shift handoffs and problem-solving
Successful scaling depends on user adoption. If the system is seen as "management surveillance" rather than a tool that helps operators do their jobs better, it will fail regardless of technical capability.
Frequently Asked Questions
What does monitoring performance mean?
Performance monitoring is the ongoing process of collecting and analyzing operational data from machines to assess how effectively they're running relative to targets. Unlike one-time inspections or scheduled checkups, it provides continuous visibility into production efficiency, uptime, and output quality.
How to measure machine performance?
Machine performance is measured using metrics like OEE, cycle time, utilization rate, and downtime frequency. Data is typically collected via sensors and monitoring software that consolidate information into real-time dashboards, enabling comparison against targets and historical baselines.
What are the 5 elements of condition monitoring?
The five core elements are:
- Vibration analysis — detects bearing wear and imbalance
- Oil/lubricant analysis — identifies contamination and degradation
- Thermography — heat imaging for thermal anomalies
- Ultrasound detection — high-frequency acoustic monitoring
- Visual inspection — direct physical assessment
Modern software platforms automate most of these continuously.
What is the difference between CBM and PdM?
Condition-Based Maintenance (CBM) triggers maintenance when a sensor reading crosses a predefined threshold — for example, vibration exceeding 0.5 inches/second. Predictive Maintenance (PdM) goes further, using data trends and AI models to forecast failures before any threshold is crossed, making it more proactive and precise.
What are the 5 types of monitoring?
The five common types in manufacturing are performance monitoring (OEE, throughput), condition monitoring (vibration, temperature), energy monitoring (power consumption), quality monitoring (defect rates, tolerances), and environmental monitoring (emissions, safety conditions). Most modern monitoring platforms integrate several of these into a single dashboard.
What is an example of an APM?
APM combines machine monitoring, condition data, and maintenance management to maximize asset reliability. In practice, an APM system might aggregate vibration and downtime data from all CNC machines in a shop, predict bearing failures using trend analysis, and auto-generate maintenance work orders in a CMMS — cutting unplanned downtime by 30%.