IPQC sits at the operational heart of quality management. While incoming quality control verifies materials before they enter production, and final quality control evaluates finished products, IPQC intercepts problems at the point of creation—when intervention is fastest, cheapest, and most effective. This article explores the steps, tools, and best practices that make IPQC a critical competitive advantage for manufacturers across automotive, aerospace, medical devices, and precision machining.
Key Takeaways
- IPQC monitors quality at defined checkpoints during production, catching defects before costs multiply
- Catching problems early cuts scrap, rework, and the chance of non-conforming parts reaching customers
- Strong programs use PFMEA to set control points, real-time measurement to catch drift, and structured corrective action to close the loop
- Core tools include Statistical Process Control (SPC), control charts, and the 7 basic QC tools
- Standardized work instructions, calibrated gauging, and empowered operators keep processes inside tolerance
What Is In-Process Quality Control (IPQC)?
In-process quality control is the practice of monitoring, measuring, and verifying product quality at defined stages during active production. Unlike incoming quality control (IQC), which evaluates raw materials before they enter the line, or final quality control (FQC), which inspects finished products at the end, IPQC operates in real time on the shop floor. That distinction matters: it intercepts problems where they originate, before defects compound into scrapped batches.
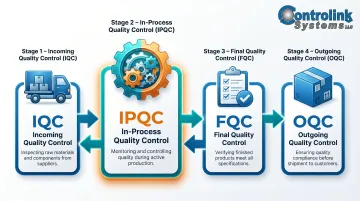
The Four-Stage Quality Spectrum:
IPQC fits within a four-stage quality framework that spans the entire manufacturing value chain:
- Incoming Quality Control (IQC): Verifies supplier materials meet specifications before entering production
- In-Process Quality Control (IPQC): Monitors quality during active manufacturing operations at critical control points
- Final Quality Control (FQC): Inspects completed products before release to shipping or inventory
- Outgoing Quality Control (OQC): Conducts final verification before products ship to customers
QC vs. QA—Where IPQC Sits:
Quality Control (QC) focuses on detecting and rejecting defects in products. Quality Assurance (QA) works upstream, preventing defects through process and system design. IPQC sits squarely at the intersection of both. It reacts to individual part measurements in real time, but the consequence is proactive: catching drift at one station stops a cascade of defects across hundreds of subsequent parts.
Why IPQC Is Critical for Manufacturing Operations
The Cost Escalation Principle
The 1-10-100 rule states that a defect caught at the machining stage costs a fraction of the same defect found at final assembly, and a fraction of what it costs when the customer discovers it.
According to research published in the IISE magazine, the cost of poor quality in manufacturing ranges from 5% to 35% of sales revenue, averaging 15%. That figure represents wasted labor, materials, overhead, and brand damage that IPQC directly reduces.
Direct Operational Benefits
IPQC reduces scrap rates, rework labor, and unplanned downtime by catching process drift before it generates large batches of non-conforming parts. Process drift includes:
- Tool wear causing dimensional creep
- Fixture shifts affecting part alignment
- Temperature variation impacting material properties
- Machine parameter changes from vibration or maintenance
By detecting these shifts early, IPQC improves First Pass Yield (FPY) (the percentage of units that pass all quality checks without rework). World-class manufacturers achieve FPY rates of 95% or higher, with top performers exceeding 98%. Each percentage point improvement translates directly into lower cost of poor quality.
Regulatory requirements add another layer of urgency to getting IPQC right.
Regulatory Compliance Mandates
In regulated industries, in-process monitoring is not optional—it's mandatory:
- FDA 21 CFR 820.70(a)(2) (Medical Devices): Requires "monitoring and control of process parameters and component and device characteristics during production"
- FDA 21 CFR 211.110 (Pharmaceuticals): Mandates in-process testing for identity, strength, quality, and purity using "suitable statistical procedures"
- ISO 9001:2015 Clause 8.5.1: Requires controlled production conditions including "monitoring and measurement activities at appropriate stages"
- IATF 16949 Clause 8.5.1.1 (Automotive): Adds control plan requirements for in-process monitoring
- AS9100D Clause 8.5.1 (Aerospace): Incorporates ISO 9001 requirements plus aerospace-specific verification
IPQC records provide the traceability evidence auditors look for, including dated measurements, operator sign-offs, and parameter logs tied to specific production runs. Gaps in that documentation are among the most common triggers for corrective action requests during third-party audits.
Key Steps in the In-Process Quality Control Process
Identify Critical Control Points
The first step is systematic analysis of the production flow to identify operations most likely to introduce quality-critical variation. Process Failure Mode and Effects Analysis (PFMEA) is the standard tool for this.
PFMEA evaluates potential failure modes on a 1-10 scale across three dimensions:
- Severity: Impact on quality, safety, and performance
- Occurrence: Probability the failure will happen
- Detectability: Ability of current controls to catch the failure before it reaches customers
Traditionally, these scores were multiplied to create a Risk Priority Number (RPN) ranging from 1 to 1,000. The harmonized AIAG-VDA FMEA methodology has replaced RPN with an Action Priority (AP) system using High, Medium, or Low designations based on a lookup table. This modern approach prioritizes control point placement more systematically than legacy RPN scoring.
Define Acceptance Criteria and Measurement Methods
Each control point must have clear, quantitative acceptance criteria derived from engineering drawings or customer specifications—not from historical production capability. The measurement method (caliper, CMM, vision system, functional test) must also be specified.
Before deployment, conduct a Gauge Repeatability and Reproducibility (Gauge R&R) study to verify measurement system capability. Per the AIAG MSA 4th Edition, measurement systems with:
- <10% GR&R are generally adequate
- 10-30% GR&R may be acceptable depending on application importance
- >30% GR&R are unacceptable and need improvement
An unreliable measurement system produces false signals—either passing non-conforming parts or rejecting conforming ones.
Conduct Real-Time Monitoring and Inspection
Operators or quality inspectors measure parts at defined control points and specified frequencies—every Nth part, at timed intervals, or 100% for safety-critical features. Results feed directly into Statistical Process Control (SPC) tools, specifically control charts, which plot measurements in time order against upper and lower control limits.
Control charts enable early detection of trends before a process goes out of control. Each chart displays:
- Center line: the mean value for the in-control process
- Upper/Lower Control Limits (UCL/LCL): set at 3-sigma (3 standard deviations) from the mean
Beyond the limits themselves, Western Electric Rules flag non-random patterns—runs of consecutive points on one side of center, or trending sequences—that signal assignable causes requiring investigation even before a point crosses a limit.
Initiate Closed-Loop Corrective Action
When a measurement signals an out-of-control condition or non-conforming part:
- Contain suspect parts produced since the last good measurement
- Notify production supervisor immediately
- Investigate root cause using tools like 5 Whys or Ishikawa diagrams
- Adjust the process before resuming production
- Document the action taken and verify effectiveness
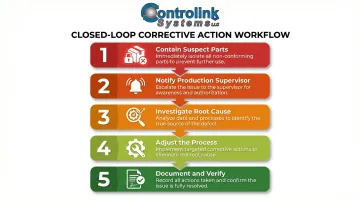
"Closed-loop" means the quality signal results in documented action—not just a data point logged and ignored. Without that documentation, the same root cause tends to resurface across shifts or after personnel changes.
Document, Track, and Review
Corrective actions only hold long-term when they're tied to traceable records. Every IPQC check must capture:
- Part number and operation
- Measurement result
- Date/time stamp
- Operator identification
- Disposition (accept/quarantine/rework)
This data feeds shift-end reports and weekly trend analysis, turning isolated measurements into actionable intelligence. Patterns that are invisible part-by-part—gradual tool wear, fixture drift across shifts—become clear once data is aggregated over time.
Best Practices for Effective In-Process Quality Control
Establish and Maintain Standardized Work Instructions
Inconsistent inspections trace back to inconsistent instructions. Document procedures in clear, step-by-step work instructions specifying:
- What to measure
- How to measure it
- What equipment to use
- What to do when readings are out of spec
These instructions must be version-controlled and kept current with engineering changes. Any mismatch between work instructions and current engineering drawings creates a quality gap.
For CNC machining environments, this extends to ensuring machines always run the latest engineering-approved NC programs. Controlink Systems' DNC software manages program distribution from a central repository to the shop floor — automatically serving the latest approved version when operators request a file, which eliminates manual selection errors and reduces scrap from outdated programs.
Train Operators as the First Line of Quality Defense
Waiting for a dedicated inspector to catch defects means they've already traveled downstream. "Quality at the source" empowers machine operators to perform IPQC checks at their own workstations — but only with structured training on:
- How to use measurement equipment correctly
- How to read and interpret control charts
- When and how to escalate concerns without fear of production pressure
The Toyota Jidoka principle embodies this approach: building quality means making it right the first time, with operators empowered to stop the line when defects are detected rather than passing defective work downstream.
Use Statistical Process Control Proactively, Not Just Reactively
SPC delivers maximum value when teams act on early warning signals—trends, runs, points approaching control limits—rather than waiting for failures to confirm a problem. Process capability indices (Cp, Cpk) assess whether a process is capable of meeting specifications by comparing process variation to specification width — before relying on inspection to catch failures.
According to automotive industry standards, Ppk values exceeding 1.67 are often required for supplier qualification.
Maintain Measurement System Integrity Through Regular Calibration
Maintain a calibration schedule for all gauges, instruments, and measurement devices used in IPQC. An uncalibrated measurement system produces unreliable data that can:
- Pass non-conforming parts (false negatives)
- Reject conforming parts (false positives)
Both outcomes are costly. Revisit Gauge R&R whenever a gauge is replaced or repaired — even minor hardware changes affect repeatability and reproducibility.
Review IPQC Data Regularly for Continuous Improvement
Use aggregated IPQC data—defect frequency by operation, machine, shift, or operator—to drive process improvement projects rather than just reacting to individual events. Pareto analysis identifies the "vital few" defect causes that account for the majority of quality failures, enabling focused improvement efforts.
McKinsey research on manufacturing quality found that advancing quality maturity reduced cost of nonquality by 30% at one industrial manufacturer, cut product deviations by >50% at a biopharma facility, and reduced waste by 75% at a third — results that start with consistently acting on what the data reveals.
Tools and Techniques Commonly Used for IPQC
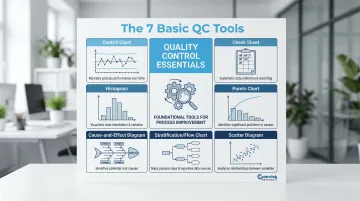
The 7 Basic QC Tools
ASQ identifies seven basic quality tools first highlighted in Kaoru Ishikawa's Guide to Quality Control:
- Control Chart: Monitors process over time to detect trends before out-of-control conditions occur
- Check Sheet: Tallies defect types at the point of occurrence for structured data collection
- Histogram: Visualizes dimensional distribution to assess process centering and spread
- Pareto Chart: Prioritizes defect causes by frequency, focusing improvement efforts on the vital few
- Cause-and-Effect Diagram (Fishbone): Investigates root causes by mapping contributing factors across categories
- Scatter Diagram: Identifies correlation between process parameters and defect rates
- Stratification/Flow Chart: Separates data by source (shift, operator, machine) to find patterns
Statistical Process Control (SPC) in Practice
Control charts are the primary SPC tool at IPQC control points. Common types include:
- X-bar and R charts: Monitor variables data (dimensional measurements) by tracking process mean and range
- p-charts or c-charts: Monitor attribute data (defect counts, pass/fail results)
NIST defines control charts as tools that plot data points in time order against statistically derived control limits. A stable process produces results within predictable limits; an unstable process exhibits points outside limits or non-random patterns indicating assignable causes.
Western Electric Rules formalize pattern detection—for example, 8 consecutive points trending in one direction signal process drift even if all points remain within control limits.
Physical Measurement and Inspection Equipment
Measurement tools used in IPQC depend on the application:
- Manual tools: Calipers, micrometers, bore gauges, thread gauges for basic dimensional checks
- Automated gauging stations: High-volume, consistent measurements with reduced operator influence
- Coordinate Measuring Machines (CMMs): Complex geometric features requiring 3D measurement
- Machine vision systems: Surface inspection, pattern recognition, defect detection
The right tool depends on the feature being measured, required precision, and production volume.
Process Monitoring Software and Shop-Floor Automation
Software-based process monitoring platforms connect real-time machine data (spindle load, cycle time, feed rates, temperature) to quality decision-making. This lets teams correlate process parameter trends with part quality before defects occur.
For CNC shops, automation software that integrates directly with machine controls provides the data visibility to support proactive IPQC without manual parameter recording. Controlink Systems builds process monitoring and shop-floor automation software for exactly this environment — connecting CNC machines and PLCs to a shared quality dataset so teams can act on process signals rather than react to finished scrap.
Common IPQC Challenges and How to Overcome Them
Natural Process Variation: Over-Control vs. Under-Control
Every manufacturing process has inherent variability. The real danger is misreading it — either treating normal fluctuation as a problem that needs fixing (over-control) or missing a genuine defect signal until it's too late (under-control).
W. Edwards Deming called unnecessary adjustments "tampering." Intervening on a stable process based on a single data point doesn't improve quality — it adds variation. The fix is proper SPC implementation with statistically derived control limits, not arbitrary tolerance-based thresholds.
Measurement System Integrity
If gauges are worn, miscalibrated, or used inconsistently between operators, IPQC data is unreliable regardless of how rigorously the inspection protocol is followed. Address this with a formal Gauge R&R program and written measurement procedures that standardize how inspections are performed. Without a validated measurement system, no control chart signal can be trusted.
Knowledge and Documentation Gaps
Experienced operators carry tacit quality knowledge (what a "good" part looks, feels, or sounds like) that is rarely written down. When those operators retire, that knowledge walks out with them. Research on workforce aging confirms the manufacturing industry is facing unprecedented retirements as the baby boomer generation exits.
Capture inspection criteria, visual reference standards, and decision logic in controlled work instructions before those operators are gone. That documentation is what separates a resilient quality system from one that degrades quietly every time a veteran retires.
Frequently Asked Questions
What are the main steps in the in-process quality control process for manufacturing?
The five key steps are: identify critical control points via PFMEA, define acceptance criteria and measurement methods with validated Gauge R&R, perform real-time inspection using SPC monitoring, initiate closed-loop corrective action on out-of-control signals, and document all results for traceability and continuous improvement.
Who is responsible for in-process quality control (IPQC) and what are their key responsibilities?
IPQC responsibility is shared across roles: quality engineers design the control plan, inspectors or trained operators execute checks, and production supervisors own corrective action. The quality manager oversees the system and ensures compliance with ISO 9001, IATF 16949, or other applicable standards.
How do you monitor and control in-process quality during production?
In-process quality is monitored through scheduled inspections at defined control points, SPC control charts tracking measurements against limits, and real-time process monitoring software. Corrective action is triggered whenever measurements indicate the process is trending out of control.
What tools and techniques (for example, the 7 QC tools) are commonly used for in-process quality control?
The 7 basic QC tools (control charts, check sheets, histograms, Pareto charts, fishbone diagrams, scatter diagrams, stratification) form the foundation. Additional techniques include SPC, PFMEA for control point identification, Gauge R&R for measurement system validation, and process monitoring software that correlates machine parameters with quality outcomes.
What are the core elements of a quality management system (QMS) for manufacturing?
Core QMS elements include quality policy and objectives, documented procedures, process control and monitoring (including IPQC), non-conformance management and CAPA, internal audits, and management review. These are typically structured around ISO 9001, with sector-specific additions for automotive, aerospace, or medical device manufacturing.
How do you monitor production efficiency in manufacturing?
Production efficiency is monitored through KPIs such as Overall Equipment Effectiveness (OEE), First Pass Yield (FPY), cycle time, scrap rate, and downtime frequency. IPQC data feeds directly into the Quality component of OEE—defects that slip through create rework, scrap, and unplanned downtime that erode all three OEE factors.
Systematic IPQC—built on validated measurement, real-time SPC monitoring, and closed-loop corrective action—keeps defects from reaching downstream operations where they cost far more to fix. Manufacturers who treat quality as an integral part of production, not an end-of-line checkpoint, consistently see lower scrap rates, higher first pass yield, and stronger customer retention.