Introduction
Walk into any machine shop at shift change and you'll hear the damage report. A batch of 300 parts scrapped overnight because a worn tool went undetected. A stamping press that drifted out of spec for three hours before anyone noticed. Dimensional measurements that looked fine during first-article inspection but crept beyond tolerance by mid-run. The fundamental problem? By the time defects are discovered through periodic inspection, dozens or hundreds of parts are already scrap.
That scrap adds up fast. The average manufacturing company spends approximately 20% of total sales on cost of poor quality—rework, scrap, customer returns, and warranty claims. The 1-10-100 rule explains why: catching a problem during the process costs $1, correcting it at inspection costs $10, and fixing it after it reaches the customer costs $100.
Continuous process monitoring closes this gap by detecting deviations during active production rather than after the fact.
This guide covers the full picture: what to monitor, which tools do the work, how to implement it on your floor, and how to keep it delivering results.
TLDR:
- Continuous monitoring tracks process variables in real time to prevent defects before they occur
- Reduces scrap and downtime by catching drift immediately instead of at batch end
- Uses sensors, DAQ hardware, and HMI dashboards to trigger immediate corrective action
- Monitor key parameters: temperature, pressure, vibration, cycle time, and dimensional checks
- Start small—focus on your highest-risk operations before expanding across the floor
What Is Continuous Process Monitoring?
Continuous process monitoring is the ongoing, real-time collection and analysis of process variables—such as temperature, pressure, spindle load, vibration, and dimensional measurements—during active production. The goal is simple: detect deviations from acceptable limits before defects or equipment failures occur, not after hundreds of parts are already scrap.
Continuous vs. Periodic Inspection
Traditional periodic inspection captures a snapshot at a single point in time: first-article checks, hourly samples, or end-of-shift audits. The trouble is that process drift happens silently between those intervals — a tool wears gradually, coolant temperature climbs, hydraulic pressure drops — and by the time the next inspection catches it, you may already have a batch of scrap.
Continuous monitoring maintains an unbroken data stream throughout the production run. When a parameter crosses a threshold, operators receive an alert immediately. Operators act in minutes, not hours.
Feedback and Feedforward Control
Continuous monitoring operates on two control principles:
- Feedback control: Responds to detected deviations by triggering corrections. Example: spindle temperature exceeds 75°C, system reduces feed rate automatically
- Feedforward control: Uses upstream process data to anticipate and prevent downstream quality issues. Example: tracking raw material hardness variation and adjusting cutting parameters proactively
Together, these two approaches cover both reaction and prevention — which is what separates continuous monitoring from traditional quality checks.
Where It's Applied
Continuous process monitoring is used across manufacturing operations including:
- CNC machining — Spindle load, vibration, cutting force, coolant temperature
- Stamping and forming — Press tonnage, cycle time, die temperature, stroke consistency
- Assembly operations — Torque verification, presence detection, cycle time tracking
- End-of-line testing — Leak detection, electrical tests, functional verification
Each of these applications depends on the same underlying infrastructure — sensors, data acquisition hardware, and software working together in real time.
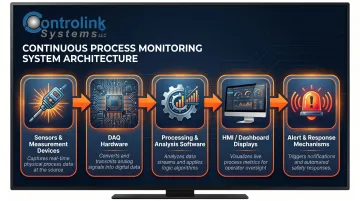
Core System Components
A complete continuous process monitoring system includes five elements:
- Sensors and measurement devices — Thermocouples, accelerometers, load cells, pressure transmitters
- Data acquisition (DAQ) hardware — Converts analog sensor signals to digital data
- Processing and analysis software — Compares real-time data to control limits, calculates trends
- HMI/dashboard displays — Gives operators real-time visibility without walking the floor
- Alert and response mechanisms — Tiered alarms that distinguish advisory warnings from critical out-of-control conditions
Key Benefits of Continuous Process Monitoring in Manufacturing
Scrap and Rework Reduction
The average manufacturing company spends 20% of total sales on cost of poor quality. Continuous monitoring attacks this at the source. When a CNC tool begins to wear, spindle load increases gradually. A continuous monitoring system detects this drift in real time and alerts the operator before dimensional accuracy degrades. The result: out-of-spec parts are prevented, not discovered after the fact.
Contrast this with batch inspection: by the time a periodic dimensional check reveals a problem, 50, 100, or 300 parts may already be outside tolerance. The entire batch becomes scrap or rework — a cost that compounds quickly across high-volume runs.
Uptime Improvement and Predictive Maintenance
Unplanned downtime costs industrial manufacturers an estimated $50 billion annually, with per-hour costs averaging $260,000. On some automotive lines, downtime reaches $2.3 million per hour.
Continuous trending of machine health indicators—vibration signatures, spindle temperature, cycle time consistency—reveals gradual equipment degradation before failures occur. This shifts maintenance from reactive (fix after failure) to predictive (intervene before failure).
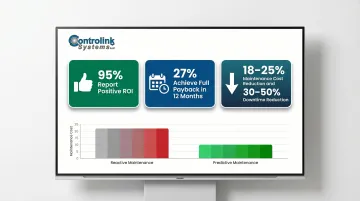
The data validates the approach: 95% of organizations implementing predictive maintenance report positive ROI, with 27% achieving full payback within 12 months. Predictive maintenance delivers 18-25% maintenance cost reductions and 30-50% downtime reductions versus reactive strategies.
Quality Traceability and Compliance
IATF 16949, AS9100, and ISO quality standards mandate product traceability throughout the production process. Continuous data logging creates a time-stamped audit trail for every production run, capturing:
- When each part was made and under what process conditions
- Which operator was on shift
- Whether parameters stayed within defined limits
This documentation satisfies regulatory requirements and accelerates root cause analysis. When a non-conformance occurs weeks after production, the data trail shows exactly what happened during that specific run — cutting investigation time dramatically.
What to Monitor: Critical Parameters and KPIs
Process Variables (Physical Parameters)
Temperature, pressure, flow rate, torque, and force are the primary inputs that directly drive product quality. In machining environments:
- Cutting fluid temperature affects surface finish and tool life
- Spindle temperature indicates bearing health and thermal expansion
- Clamping force affects dimensional accuracy and part consistency
- Hydraulic pressure (in stamping) determines tonnage repeatability
These variables should be monitored whenever they directly impact the part's critical characteristics.
Machine Health Indicators
Leading indicators of tool wear, mechanical looseness, or equipment degradation include:
- Spindle load: Gradual increases signal tool dulling before failure occurs
- Vibration signatures: Frequency analysis reveals bearing wear, imbalance, or looseness
- Cycle time: Increasing duration indicates degraded machine performance
- Feed/speed rates: Deviations from programmed values point to mechanical issues
Trending these values over time helps distinguish normal process variation from drift that requires operator intervention.
In-Process Quality Measurements
Real-time dimensional gauging, surface finish probing, and Statistical Process Control (SPC) charts with upper and lower control limits (UCL/LCL) provide direct quality feedback during machining, not after. This enables immediate correction before additional parts are produced.
Two distinct measurement types serve different purposes:
- In-process measurement — Real-time, during machining (e.g., touch probes, laser micrometers)
- End-of-line testing — Post-production verification (e.g., CMM inspection, functional tests)
Both are valuable, but in-process measurement enables prevention, while end-of-line testing provides detection.
Production KPIs Tied to Business Outcomes
Process-level data feeds higher-level operational metrics:
- OEE (Overall Equipment Effectiveness) — Availability × Performance × Quality
- Cycle time — Actual vs. planned production rate
- Throughput — Parts per hour/shift
- Downtime event frequency — Number and duration of stops
These KPIs bridge shop-floor data to business performance, enabling data-driven decisions about capacity, staffing, and capital investment. But those decisions are only as reliable as the alarm thresholds behind them.
Alert Thresholds and Control Limits
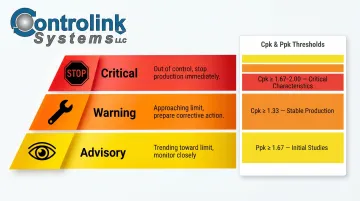
Effective monitoring depends on pre-defined alarm setpoints derived from process capability studies (Cpk analysis). AIAG PPAP requirements specify:
- Initial process studies: Ppk ≥ 1.67
- Ongoing stable production: Cpk ≥ 1.33
- Critical/safety characteristics: Cpk ≥ 1.67 or 2.00
Tiered alert levels distinguish advisory warnings (trending toward limit) from critical out-of-control conditions (immediate intervention required). This prevents operators from ignoring nuisance alarms.
Technologies and Tools That Power Continuous Process Monitoring
Sensors and Transducers
Common sensor types in manufacturing monitoring:
- Thermocouples and RTDs — Temperature measurement (furnaces, molds, spindles)
- Pressure transmitters — Hydraulic press tonnage, coolant pressure
- Accelerometers — Vibration monitoring for spindle health and bearing condition
- Load cells — Force and weight measurement
- Proximity/position sensors — Part presence, tool position, fixture verification
Sensor selection must account for measurement range, accuracy, environmental conditions (IP67/IP68 ratings for coolant exposure), and update frequency. Once sensors are chosen, the next challenge is capturing and digitizing that signal stream reliably — which is where DAQ hardware and PLCs take over.
Data Acquisition Hardware and PLCs
DAQ systems digitize analog sensor signals for processing. PLCs execute closed-loop control actions in response to monitored conditions.
NI (National Instruments, now part of Emerson) DAQ hardware is an industry-standard platform for high-speed process monitoring. The NI CompactDAQ system offers 70+ C Series I/O modules covering temperature, vibration, strain, and digital I/O, with operating range of -40°C to 70°C and 50g shock rating—built for harsh shop environments.
Controlink Systems has been an NI Partner Network member since 2000, making NI-based architectures a proven foundation for manufacturing monitoring systems.
SCADA, HMI, and Monitoring Software
Supervisory control and data acquisition (SCADA) systems aggregate data from multiple machines and processes into a unified view. HMI dashboards give operators real-time visibility into process status without physically walking the shop floor.
The global SCADA market was valued at $10.61 billion in 2023, projected to reach $23.57 billion by 2032, with discrete manufacturing as the fastest-growing segment at 11.17% CAGR. That growth rate reflects how quickly shops are moving beyond manual oversight.
Purpose-built manufacturing monitoring software, such as Controlink Systems' high-speed process monitoring solutions, is designed to run continuously in tough shop environments. Operator-friendly displays reduce training time and improve response speed when conditions drift out of spec.
Communication Protocols and System Integration
Field devices communicate with monitoring software via industrial protocols:
| Protocol | Key Characteristics | Typical Use Case |
|---|---|---|
| EtherCAT | Cycle times ≤ 100 microseconds; up to 65,535 devices | High-speed servo drives, motion control |
| Modbus | Simple master/slave architecture; RTU (serial) and TCP (Ethernet) variants | Legacy device integration, basic sensor communication |
| Profinet | Industrial Ethernet; real-time (RT) and isochronous real-time (IRT) | Factory automation, PLC-to-device communication |
| CANbus | Multi-master, message-based; robust in electrically noisy environments | Embedded machine control, automotive cells |
| OPC UA | Platform-independent; x509 certificate security; scalable chip-to-cloud | Machine-to-MES/ERP data exchange, cross-vendor interoperability |
Multi-protocol support is critical in shops with mixed equipment vintages and vendors—it determines whether a monitoring system can link all machines into a unified data picture.
Data Logging, SPC, and Reporting
Once data arrives from the field, it moves into analysis and storage layers that turn raw readings into actionable quality information:
- SPC software — Statistical trend analysis, control charts, Cpk calculations
- Historian databases — Long-term traceability and compliance documentation
- Reporting tools — Quality documentation, production summaries, downtime analysis
- MES/ERP integration — Connecting shop-floor data to production scheduling and business decisions
Each layer builds on the one before it — SPC catches process drift early, historians provide the audit trail, and MES/ERP integration ensures that quality data reaches the people making production and scheduling decisions.
How to Implement Continuous Process Monitoring: Step by Step
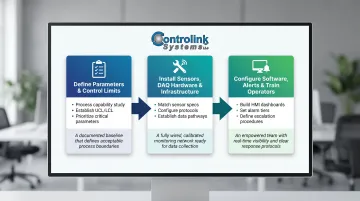
Step 1 — Define What to Monitor and Set Control Limits
Begin with a process capability study to identify which parameters most directly affect quality and equipment reliability. Establish acceptable operating ranges, UCL/LCL values, and alarm thresholds before selecting or installing any hardware.
Prioritize a manageable set of critical parameters rather than attempting to monitor everything simultaneously. Focus on:
- Parameters with the tightest tolerances
- Operations with the highest scrap rates
- Equipment with the most frequent unplanned downtime
Derive control limits from Cpk analysis—AIAG PPAP standards provide industry-accepted thresholds.
Step 2 — Select and Install Sensors, DAQ Hardware, and Communication Infrastructure
Match sensor specifications to process conditions:
- Range: Cover the full operating span plus a safety margin
- Accuracy: 10× tighter than the monitored tolerance — for a ±0.001″ part spec, that means ±0.0001″ sensor accuracy or better
- Temperature rating: Account for ambient shop temperature plus process heat
- IP rating: IP67 minimum for coolant-exposure environments
Establish reliable data pathways between field devices and monitoring software, including cabling, network infrastructure, and protocol configuration for PLC and machine tool interfaces.
Step 3 — Configure Software, Dashboards, Alerts, and Operator Procedures
Build HMI displays showing real-time trend charts for critical parameters. Configure alarm setpoints with appropriate priority levels:
- Advisory — Trending toward limit, no immediate action required
- Warning — Approaching limit, investigate and prepare corrective action
- Critical — Out of control, stop production and correct immediately
Define escalation procedures for each alarm level. Then train operators and engineers to interpret trend data, respond to alarms correctly, and use historical logs for troubleshooting — not just reacting to faults, but understanding why they occurred.
With these three steps in place, your monitoring system shifts from a passive recorder to an active quality and reliability tool.
Common Challenges and How to Overcome Them
Alert Fatigue from Poorly Configured Alarm Systems
When too many alarms trigger too frequently, operators begin to ignore them—defeating the purpose of continuous monitoring. EEMUA 191 guidelines specify no more than 6 alarm occurrences per hour (one every 10 minutes). Over 90% of SCADA/HMI installations have alarming configured, but the majority suffer from nuisance alarm overload.
Best practice: Rationalize alarms rigorously. Eliminate nuisance alarms, use tiered alert levels, and periodically audit alarm frequency to keep the system actionable.
Integrating Monitoring Systems with Legacy or Mixed-Vintage Equipment
Many shops run CNC machines, PLCs, and test systems from multiple eras and vendors with different communication interfaces. 51% of industrial facilities still rely on run-to-failure maintenance for at least part of their equipment, and over 50% plan capital investments to replace outdated equipment.
Best practice: Select monitoring platforms that support a broad range of industrial protocols and can use protocol converters or OPC connectivity to bridge legacy equipment into the system without full machine replacement.
Sustaining the Monitoring System Over Time
Sensors drift, control limits become stale as processes change, and system ownership often erodes. Address this by treating the monitoring system as a maintained asset:
- Assign clear ownership for sensor calibration and control limit reviews
- Revisit control limits whenever processes change — not just on a fixed schedule
- Schedule regular performance audits to catch drift before it causes problems
Frequently Asked Questions
What is continuous process monitoring?
Continuous process monitoring is the ongoing, real-time tracking and analysis of critical process variables during manufacturing operations—such as temperature, pressure, vibration, and dimensional measurements—to detect deviations and prevent defects or equipment failures before they escalate.
What is the difference between continuous process monitoring and periodic inspection?
Periodic inspection captures quality at a single moment (first-article or end-of-shift checks), while continuous monitoring maintains an unbroken data stream throughout production. This enables immediate response to process drift rather than discovering problems after the fact.
What are the most important KPIs to track in manufacturing process monitoring?
Key metrics include OEE (Overall Equipment Effectiveness), cycle time consistency, first-pass yield, scrap rate, machine uptime, and in-process SPC control limits. High-volume shops typically prioritize OEE and first-pass yield; precision operations focus on SPC control limits and scrap rate.
How does continuous process monitoring reduce scrap and downtime?
Real-time detection of parameter drift allows operators to correct the process before defective parts are produced. Trending machine health indicators (vibration, temperature, cycle time) enables predictive maintenance that prevents unplanned equipment failures.
What sensors and tools are commonly used in continuous process monitoring?
Common sensors include thermocouples, accelerometers, pressure transmitters, load cells, and position sensors. Data acquisition hardware, PLC-based control systems, and HMI/SCADA software tie these sensors into a unified monitoring architecture.
How do I get started with continuous process monitoring in my shop?
Start by identifying your most critical process parameters and quality pain points. Conduct a basic process capability assessment to establish control limits, then build monitoring capability incrementally, starting with the highest-risk operations and expanding from there.