This guide covers everything you need to understand production monitoring systems: what they are, how they work, which metrics matter most, and how to choose the right solution for your manufacturing environment.
TLDR:
- Production monitoring captures, tracks, and analyzes real-time data from machines, people, and processes to ensure output targets are met
- Core system components include hardware (sensors, PLCs), software (SCADA, MES integration), visualization (dashboards, alerts), and people/process workflows
- Critical metrics: OEE (availability × performance × quality), downtime (MTBF/MTTR), cycle time vs. takt time, and scrap/rework rates
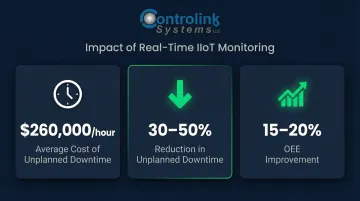
- Real-time monitoring reduces unplanned downtime by 30-50% and can boost OEE by 15-20%
- Choose systems with open protocol support, simple operator interfaces, and proven CNC/machining expertise
What Is a Production Monitoring System?
Production monitoring is the ongoing, systematic practice of capturing, tracking, and analyzing data from people, machines, and processes on the shop floor to ensure output targets are met and problems are resolved quickly. Unlike end-of-day reports or manual clipboard checks that tell you what went wrong hours after it happened, production monitoring delivers visibility while the shift is still running—when you can still do something about it.
Production Monitoring vs. Process Monitoring
These terms are often confused, but they serve different purposes. Each addresses a distinct layer of the shop floor:
- Production monitoring tracks outputs and throughput at a line or facility level: parts made, idle time on Machine 5, scrap rate this shift
- Process monitoring focuses on in-process parameters—temperature, pressure, vibration, torque, tool load—that directly govern part quality during machining
Both are interconnected. High-performing shops track both simultaneously: production monitoring tells you what is happening to output, while process monitoring tells you why.
Production Monitoring vs. Manufacturing Execution Systems (MES)
According to the ISA-95 standard, production and process monitoring reside in Levels 1 and 2 of the manufacturing architecture—the sensing, control, and supervisory layers that interact directly with machines and PLCs. An MES, by contrast, operates at Level 3, handling broader manufacturing operations management: work orders, scheduling, traceability, materials, and electronic batch records. Production monitoring is the real-time data capture and visibility layer that often feeds into or pulls from an MES without replacing it. A monitoring system captures what's happening on the line right now; the MES uses that data to schedule, route, and manage what happens next.
What "Real-Time" Actually Means
Real-time production monitoring means data is captured and displayed as events occur—not batched into end-of-shift summaries. When a machine faults, a cycle time drifts out of spec, or a part count stalls, supervisors see it immediately and can intervene mid-shift rather than discovering the problem in tomorrow morning's report. That's the difference between correcting a problem at 10 a.m. and explaining the lost output at 6 a.m. the next day.
From Clipboards to Connected Systems
As of 2024, 54% of small- and medium-sized plants globally still relied on pen, paper, and spreadsheets as their primary manufacturing tracking system. Manual methods hold up when you have a handful of machines and simple processes. They break down as machine counts and production complexity grow.
Digital monitoring systems using IIoT sensors, PLCs, and purpose-built software have become essential because manual tracking can't keep pace with the speed and volume of data modern manufacturing generates.
Key Components of a Production Monitoring System
A production monitoring system isn't a single piece of software or hardware—it's four interconnected layers working together: hardware (data capture), software (processing and integration), visualization/analytics (insight delivery), and human/process (action and response). Each layer depends on the others to deliver value.
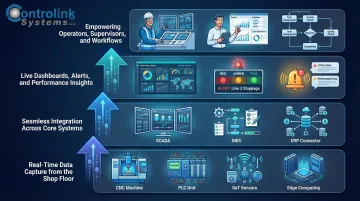
Hardware Layer: Data Capture
The physical components generate and transmit production data. CNC machines and their controllers (PLCs, DCS) are the primary sources, outputting machine states, cycle times, and part counts. IIoT sensors extend that coverage by measuring:
- Vibration and acoustic emissions
- Temperature and pressure
- Current draw and power consumption
Edge devices sit between the shop floor and higher-level systems, preprocessing signals, translating legacy protocols, and reducing latency before data moves upstream.
Networking infrastructure ties it all together. Industrial Ethernet protocols—Modbus, Profinet, EtherNet/IP, EtherCAT—enable reliable, real-time data transmission between machines and software systems. According to HMS Networks' 2025 analysis, Ethernet-based networks now account for 76% of new industrial installations, with PROFINET leading at 27%, EtherNet/IP at 23%, and EtherCAT at 17%. Protocol compatibility with your existing equipment is a real constraint when evaluating systems—if your monitoring platform doesn't speak the same language as your machines, integration becomes expensive and complex.
Software Layer: Collection and Integration
SCADA systems, MES platforms, and data middleware standardize inputs from PLCs and sensors, track machine states (running, idle, faulted, down), and connect production data with enterprise systems like ERP.
Protocol breadth is what separates flexible software from brittle solutions. Support for CAN, UDS, Modbus, Serial, Profinet, and EtherCAT allows monitoring software to speak directly to existing equipment. Controlink Systems LLC, with over 25 years in CNC/DNC and process monitoring, builds native support for these protocols into its software—so manufacturers can add monitoring without replacing functional legacy equipment.
Visualization and Analytics Layer
Raw data is useless until it's turned into actionable insight. Dashboards, HMI displays, andon boards, and reporting tools make that translation. KPI dashboards give supervisors at-a-glance visibility into OEE, throughput, and downtime. Pareto charts identify which machines or failure modes cause the most losses. Threshold-based alerts—via SMS, email, or in-app notifications—notify the right person the moment a machine faults or a metric goes out of range, so problems are addressed in minutes, not hours.
Human and Process Layer
Technology only delivers value when people and workflows are aligned with it. Operators log downtime causes and flag anomalies, supervisors act on alerts, and standard procedures define escalation paths. Without this layer, dashboards become wallpaper that no one acts on. Successful monitoring implementations involve operators in design, give them feedback that helps their own performance, and make interfaces simple enough that logging data adds no friction to their core work.
Critical Metrics Every Manufacturing Shop Should Track
OEE: The Headline Metric
Overall Equipment Effectiveness (OEE) is defined by the SEMI E79 standard as the fraction of total time that equipment processes effective units, assuming theoretically efficient time standards. The formula is:
OEE = Availability Efficiency × Operational Efficiency (Performance) × Quality Efficiency
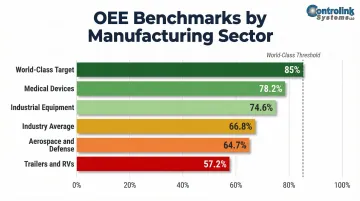
World-class OEE for discrete manufacturers is 85%, but the average operation runs at 66.8%. Typical ranges vary by sector: Medical Devices average 78.2%, Industrial Equipment 74.6%, Aerospace & Defense 64.7%, and Trailers & RVs 57.2%.
OEE's real power comes from breaking it into components to pinpoint whether losses stem from downtime (availability), speed reduction (performance), or defects (quality) — rather than treating it as a single composite score.
Throughput, Cycle Time, and Takt Time
These three metrics work together to reveal efficiency and waste:
- Throughput measures parts produced per period (shift, day, week)
- Cycle time is how long a unit actually takes to complete
- Takt time is how long it should take to meet customer demand
The gap between cycle time and takt time reveals where waste and overproduction risk live. Monitoring these in real time lets teams rebalance work mid-shift, moving operators or adjusting schedules before backlogs form.
How to Interpret Downtime Data
Throughput gaps often trace back to downtime — which is why logging machine states alongside operator-entered root causes turns raw numbers into a useful improvement record. Two reliability metrics support proactive maintenance planning:
- MTBF (Mean Time Between Failures): The predicted elapsed time between inherent failures during normal operation—a reliability metric for repairable systems
- MTTR (Mean Time to Repair): The average time required to diagnose, repair, and fully restore a system after a failure—a maintainability metric
Tracking both reveals whether downtime problems stem from equipment reliability (low MTBF) or slow response (high MTTR).
Quality Metrics That Hit the Bottom Line
Quality metrics tie directly to cost. High scrap and rework rates signal process instability and inflate both labor and material costs.
The overall Cost of Poor Quality amounts to 15-20% of every dollar earned in manufacturing. Key quality metrics to monitor in real time include:
- Scrap rate: Percentage of parts that cannot be reworked or used
- First-pass yield (FPY): Share of units completing production without any rework
- Rework rate: Parts requiring correction before meeting spec — a leading indicator of process drift
Bottom performers see scrap and rework consume up to 2.2% of annual revenue; top performers hold that to 0.6%. Catching drift in real time — rather than at end-of-shift — is what separates those two outcomes.
Benefits of Real-Time Production Monitoring
Improved OEE and Reduced Downtime
The average cost of unplanned downtime across general manufacturing is $260,000 per hour. In highly automated sectors like automotive, it reaches $2.3 million per hour. IIoT sensors and real-time predictive monitoring reduce unplanned downtime by 30–50% and can boost OEE by 15–20%. When teams can see machine states, cycle deviations, and micro-stops as they happen, they intervene before minor issues compound into shift-level losses.
Quality and Consistency Benefits
Connecting monitoring data with inspection and test results creates a direct link between process variation and defect spikes. Supervisors catch and correct the root cause rather than sorting bad parts after the fact. Mueller Company achieved a 90% reduction in scrap and rework by implementing real-time statistical process control and automated data collection, reducing escaped defective pieces from 8% to 0.5%. That means lower cost-per-part and fewer customer complaints reaching the end of the line.
Resource Optimization and Customer Satisfaction
Quality gains feed directly into operational efficiency. Live production data enables:
- Smarter staffing decisions (rebalancing operators between high- and low-performing lines)
- Better on-time delivery performance
- Accurate customer status updates during production
Plants that can tell a customer exactly where their order stands — and deliver on that answer — don't have to compete on price alone.
Common Implementation Challenges and How to Overcome Them
Data Silos and Disconnected Legacy Systems
Plants often have data scattered across old machines, separate software platforms, and spreadsheets that never talk to each other. The average age of CNC machines in production facilities is 8.7 years, and approximately 64% of manufacturers rate their shop-floor IT capabilities as average, weak, or non-existent. Many older CNC machines lack native network ports or modern communication interfaces.
Choose monitoring tools with open APIs and support for standard industrial protocols (MTConnect, OPC UA, Modbus, Profinet) that aggregate data into a single view without creating yet another isolated system. Retrofitting legacy machines with hardware adapters, serial-to-Ethernet converters, and edge gateways typically costs less than 20% of purchasing new equipment — a clear financial advantage for any mechanically sound asset.
Operator Engagement and Perceived Surveillance
Productivity monitoring is frequently viewed as threatening by experienced machinists. Monitoring tools perceived as surveillance rather than support will be ignored or gamed.
Involve operators in the design process from the start. Give them access to feedback that directly helps their own work:
- Downtime cause logging so issues get attributed correctly
- Shift summaries that show progress at a glance
- Alerts for tooling or material shortages before they cause stoppages
- Simple interfaces that add no friction to their core tasks
Frame data collection as a tool for removing shop-floor obstacles, not tracking individual performance.
Inconsistent Metric Definitions
When everyone defines "downtime" differently across shifts or sites, conversations devolve into debating numbers rather than improving them.
Research from LNS Research finds that OEE projects frequently stall because business leaders define Operational Excellence priorities without aligning them with technology leaders — producing systems that lack buy-in and underperform.
Standardize KPI calculations before rollout, not after. Document every definition, get agreement from all stakeholders, and configure the system to calculate metrics consistently across every shift and site.
How to Choose the Right Production Monitoring System for Your Shop
Evaluate Compatibility and Integration
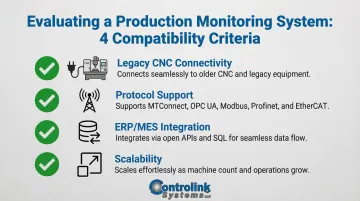
Confirm the system speaks the protocols your floor already uses. Before evaluating vendors, check these four areas:
- Connects to legacy CNC equipment, not just modern machines
- Supports common shop protocols: MTConnect, OPC UA, Modbus, Profinet, and EtherCAT
- Integrates with your ERP or MES via open APIs and SQL database access
- Maintains performance as your machine count grows
Prioritize User Interface Simplicity
A complex HMI increases training costs and slows adoption. Look for interfaces operators can learn in a shift and supervisors can configure without writing a single line of code.
Controlink Systems LLC, for example, builds its HMI specifically for shop-floor operators — not IT departments. After 25 years developing CNC/DNC software for machine shops, their interfaces reflect how machinists actually work, which shortens the ramp-up time considerably.
Start with a Clear Scope
Identify the two or three most painful metrics — unplanned downtime and scrap rate, for example — before selecting a system. Choose a platform that solves those first while leaving room to expand. Overly complex rollouts fail because they try to monitor everything before establishing any workflow around the data. Three metrics your team acts on beat twenty that gather dust.
Verify Domain Expertise
Generic manufacturing software isn't built for the precision demands of machining environments. Look for vendors with proven experience in CNC machine shops, DNC communications, and process monitoring — not just general Industry 4.0 platforms. Ask for references from similar operations and confirm the vendor understands your specific equipment and workflows.
Frequently Asked Questions
What is process monitoring in manufacturing?
Process monitoring focuses on tracking in-process parameters—such as temperature, pressure, vibration, and tool load—that directly affect part quality during machining or production. It distinguishes itself from production monitoring, which tracks output-level metrics like throughput and OEE.
What is real-time production monitoring?
Real-time production monitoring means data from machines, sensors, and operators is captured and displayed as events occur—not batched into end-of-day reports. Supervisors can identify and respond to problems while the shift is still running, catching deviations before hundreds of scrap parts are produced.
What is process control in manufacturing?
Process control is the active changing of process parameters based on monitoring data. Once monitoring tools detect an out-of-control condition, the responsible person (or automated system) adjusts speed, temperature, feed rate, or other variables to bring the process back within specification.
What metrics should a production monitoring system track?
Core metrics include OEE (availability, performance, quality), throughput, cycle time vs. takt time, planned and unplanned downtime (MTBF/MTTR), and scrap/rework rates. Together, these give a complete picture of line efficiency and product quality.
What is the difference between production monitoring and an MES?
An MES handles broader manufacturing management functions—work orders, scheduling, traceability, electronic batch records. Production monitoring focuses specifically on real-time visibility into machine and process performance. The two typically work together, with monitoring feeding live data into the MES for higher-level decision-making.
How does production monitoring reduce scrap and downtime?
Monitoring systems surface deviations in cycle time, machine state, and process parameters as they happen. Operators can catch the root cause of defects and equipment issues before they affect a full batch or cause an extended stoppage—shifting from reactive response to early correction.
Ready to bring real-time visibility to your shop floor? Controlink Systems LLC has been building CNC/DNC and process monitoring solutions for manufacturers since 1998—serving customers from job shops to national laboratories like Oak Ridge. Contact us at (800) 838-3479 or visit our website to discuss how our CNC/DNC and process monitoring solutions can fit your operation.