Introduction
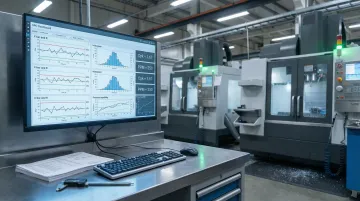
Picture this: a CNC machining center runs an entire third shift producing parts that are 0.003 inches out of spec. By the time the first-shift quality inspector catches the deviation during morning inspection, 200 parts are already scrap, the production schedule is blown, and the supervisor is scrambling to explain a $15,000 loss to management. This scenario plays out in machine shops across the country every week — the problem isn't operator skill, it's the absence of real-time visibility.
Without real-time data, manufacturers operate blind:
- Maintenance teams react to breakdowns instead of preventing them
- Machinists unknowingly run outdated CNC programs, producing incorrect parts
- Quality defects pile up undetected until end-of-line inspection
- Supervisors make decisions based on yesterday's numbers — or gut feel
This guide explains what real-time analytics is, the specific shop-floor problems it eliminates, the measurable ROI it delivers, the technologies that make it possible, and a practical roadmap for implementation.
TLDR:
- Real-time analytics eliminates reactive decision-making by surfacing machine, quality, and production data as events occur
- Unplanned downtime costs Fortune 500 manufacturers $1.5 trillion annually — predictive maintenance cuts this by 30-50%
- Shops implementing live monitoring see 5-7 point OEE improvements and scrap reductions of 40% or more
- IIoT sensors, DNC software, and MES/ERP integration connect your machines to the data you need to act on
- Start with a focused pilot targeting a single problem — scrap rates or unplanned downtime — measure results, then scale
What Is Real-Time Analytics in Manufacturing?
Real-time analytics in manufacturing is the continuous collection and analysis of data from machines, sensors, and production systems as events occur — enabling decisions in real time rather than waiting on batch reports or end-of-shift summaries.
Consider a spindle bearing failure: without real-time monitoring, you discover it when the machine stops. With vibration sensors feeding continuous data, the anomaly surfaces three days earlier — before production halts. The same principle applies to quality. In-process sensors catch a process drift mid-run and trigger a corrective adjustment before defects accumulate to final inspection.
The Four Stages of Analytics Maturity
Manufacturers typically progress through four stages of analytics capability:
- Descriptive (What Happened): Historical reporting that shows past performance — weekly production summaries, monthly scrap totals, quarterly downtime reports
- Diagnostic (Why It Happened): Root cause analysis that explains deviations — identifying that a quality spike was caused by tool wear or that downtime was triggered by a hydraulic pressure drop
- Predictive (What Will Happen): Forecasting models that anticipate future events — predicting when a bearing will fail based on vibration trends or when a cutting tool will exceed wear limits
- Prescriptive (What Should Be Done): Automated recommendations that guide decisions — suggesting optimal maintenance windows, recommended process adjustments, or dynamic production schedule changes
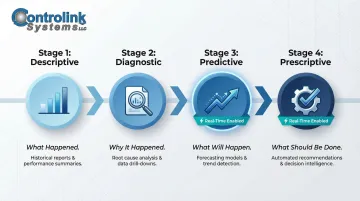
Real-time data is what separates the first two stages from the last two. Without continuous data streams, predictive and prescriptive capabilities simply aren't possible — and manufacturers stay locked in reactive analysis.
Why Real-Time Analytics Is Critical in Manufacturing
Manufacturing has unique characteristics that make real-time visibility more valuable than in most other industries:
- Tight tolerances: A 0.001-inch deviation can render a part unusable, and that deviation can occur within seconds of a process change
- High-volume production cycles: A single undetected defect can multiply into thousands of scrapped units before the next inspection point
- Compounding cost of defects: Catching a quality issue at the machine costs pennies; catching it after assembly costs dollars; catching it after shipment costs hundreds or thousands
- Direct downtime costs: Every unplanned minute of machine downtime has a measurable dollar impact on throughput, labor utilization, and delivery commitments
Key Challenges Real-Time Analytics Solves on the Shop Floor
Unplanned Downtime and Equipment Failures
Traditional maintenance is reactive — operators discover a problem only after a machine fails, triggering expensive emergency shutdowns, expedited parts orders, and scrambled production rescheduling.
Real-time sensor data monitoring vibration, temperature, spindle load, and hydraulic pressure allows anomalies to be flagged before failure occurs. Maintenance teams schedule interventions during planned windows rather than responding to 2 a.m. breakdowns.
The financial impact is substantial: Unplanned downtime costs Fortune Global 500 industrial companies $1.5 trillion annually — representing 11% of yearly revenues. The average large plant loses $129 million per year to unplanned halts, a 65% increase in just two years.
Poor Product Quality and High Scrap Rates
Quality defects often go undetected until end-of-line inspection — or worse, after shipment to the customer. By that point, rework costs, material waste, and reputational damage have already compounded.
Real-time in-process monitoring enables immediate corrective adjustments before defects accumulate. For CNC machining, this means live feedback on tool wear, cutting parameters, and part dimensions during the run rather than during final inspection.
Example: Pinnacle Machine Works implemented real-time data collection and SPC software on its CNC shop floor. Their reject rate dropped from 3% to 1.3%, saving over $180,000 in lost material and increasing overall shop productivity by 45%.
Operational Inefficiency and Production Bottlenecks
Without live shop-floor visibility, machine utilization is difficult to track, bottlenecks go unidentified for long periods, and supervisors rely on manual walkthroughs or end-of-shift reports.
Real-time dashboards expose:
- Underutilized machines sitting idle while other workstations are overloaded
- Cycle time variances that indicate process inefficiencies
- Queue times and work-in-process buildup at specific operations
- Operator idle time caused by material shortages or setup delays
This visibility allows supervisors to dynamically reassign operators, rebalance workloads, and eliminate unnecessary cross-floor communication.
Outdated CNC Program Files and Version Control Errors
Unlike the broader operational challenges above, this one is specific to CNC environments: machinists running older or unauthorized versions of engineering-approved NC programs, resulting in incorrect parts and scrap.
Real-time DNC (Distributed Numerical Control) communication software ensures only the latest, engineering-approved files are delivered to the machine at the right time — directly reducing this category of error. Controlink Systems LLC has built its DNC software around exactly this problem, giving CNC shops file delivery control, version tracking, and machine connectivity from a single platform.
Supply Chain and Inventory Disruptions
Supply disruptions are often invisible until a line stops. Real-time inventory data and supplier feed integration surface problems early, giving operations teams room to act. Typical alerts include:
- Stock levels falling below minimum thresholds for critical materials
- Supplier delivery delays flagged against scheduled production windows
- Work-in-process shortages at specific operations before they cause idle time
- Automated schedule adjustment triggers when materials are rerouted or expedited
The Top Benefits of Real-Time Analytics in Manufacturing
Improved Overall Equipment Effectiveness (OEE)
OEE measures the three fundamental components of production efficiency:
- Availability: Percentage of scheduled time the machine is actually running
- Performance: Actual cycle time versus ideal cycle time
- Quality: Good parts produced versus total parts produced
Tracking these components in real time allows manufacturers to identify and eliminate losses without purchasing new equipment.
The average OEE for discrete manufacturing is 66.8% — well below the 85% "world-class" benchmark. That gap represents massive untapped capacity. Manufacturers implementing real-time machine monitoring report OEE improvements averaging 5 to 7 percentage points, largely driven by increased availability after identifying root causes of unplanned downtime.
Reduced Scrap and Rework Costs
OEE gains are only part of the financial picture. Immediate data feedback loops allow process deviations to be corrected mid-run rather than discovered post-production — savings that stack across material, labor, and machine time.
The Cost of Poor Quality (COPQ) consumes 15% to 20% of total sales revenue for many manufacturers — encompassing scrap materials, rework expenses, warranty claims, and lost machine capacity.
Predictive Maintenance Cost Savings
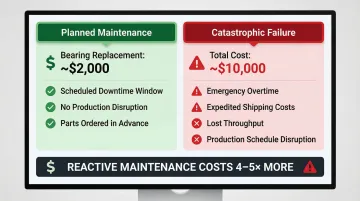
The cost differential between proactive and reactive maintenance is stark. Consider a single bearing replacement:
- Planned shutdown repair: ~$2,000 in parts and labor
- Catastrophic failure mid-production: ~$10,000 in parts, overtime, expedited shipping, and lost throughput
- Net difference: 4 to 5x more expensive to react than to prevent
Enhanced Workforce Productivity
Real-time task completion and machine status data lets supervisors dynamically reassign operators to balance workloads, minimize idle time, and reduce unnecessary cross-floor communication. When operators can access current NC programs, setup sheets, and job instructions at the machine — without leaving their workstation to track down engineering or search file servers — productive time increases measurably.
This is the core principle behind shop-floor automation tools like those from Controlink: keep machinists machining rather than waiting or walking.
Faster, Data-Driven Decision-Making at Every Level
Real-time analytics replaces gut-feel and stale weekly reports with a shared, accurate view of operations:
- Machine operators receive live alerts about process deviations or tool wear
- Supervisors review real-time OEE dashboards to identify bottlenecks and reassign resources
- Plant managers monitor production against schedule and adjust priorities dynamically
- Executives model capacity scenarios and make capital investment decisions based on actual utilization data
Technologies That Power Real-Time Manufacturing Analytics
Industrial IoT (IIoT) Sensors and Connected Devices
Sensors affixed to machines continuously capture temperature, vibration, pressure, spindle load, and cycle counts — forming the raw data foundation on which all real-time analytics depends.
Without instrumented machines, there is no data to analyze.
The number of connected IoT devices is forecast to reach 21.1 billion by 2025, with industrial applications driving much of this growth.
Real shops have seen measurable gains from this connectivity:
- Senior Aerospace AMT achieved a 15–20% increase in shop floor utilization after deploying a machine monitoring platform
- LeClaire Manufacturing boosted vertical machining utilization by 38 percentage points using real-time metrics and deviation alerts
Process Monitoring and CNC/DNC Communication Software
Raw sensor data only becomes actionable when the right software layer moves it where it needs to go. Shop-floor automation software transmits live machine data, manages CNC program file delivery, interfaces with PLCs and motion controllers, and connects to SQL databases.
Controlink's process monitoring and DNC communication solutions are purpose-built for exactly this layer, supporting a wide range of protocols:
- Modbus
- Profinet
- EtherCAT
- Serial
- CAN
This connectivity links legacy and modern equipment into a unified data environment. Machinists receive the latest engineering-approved NC programs, while supervisors gain real-time visibility into machine status across the floor.
AI and Machine Learning
ML models process continuous sensor streams to detect subtle performance anomalies — such as gradual changes in spindle vibration indicating tool wear — that human operators would miss.
These models generate predictive maintenance alerts and quality flags automatically, enabling maintenance teams to act before failures occur.
Example: An automotive component manufacturer used vibration and process analytics on bottleneck CNC machining centers. The predictive maintenance solution detected grease leaks and bearing wear early, replacing 8 hours of unplanned downtime with 3 hours of planned maintenance and saving $1.1 million annually.
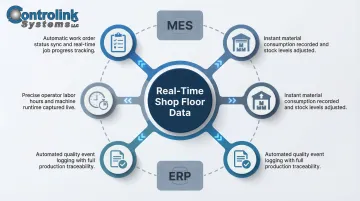
Manufacturing Execution Systems (MES) and ERP Integration
Connecting real-time floor data to MES and ERP systems ties production scheduling, material inventory, quality records, and financial data into a single operational picture — enabling decisions that span the entire production workflow, not just individual machines.
This integration allows:
- Automatic work order updates as jobs complete
- Real-time inventory deductions as materials are consumed
- Quality data flowing directly into traceability systems
- Labor tracking tied to actual machine runtime
Cloud and Edge Computing
These two computing models handle different time horizons — one responds in milliseconds, the other works across weeks of data.
Edge computing handles time-sensitive, low-latency decisions at the machine level — triggering an adjustment before the next part cycle, stopping a spindle when vibration exceeds thresholds, or alerting an operator to a quality deviation.
Cloud computing aggregates data across machines and sites for longer-horizon analysis, reporting, and cross-team access — enabling plant managers to compare performance across lines, executives to model capacity scenarios, and engineers to analyze process trends over weeks or months.
How to Implement Real-Time Analytics: A Step-by-Step Approach
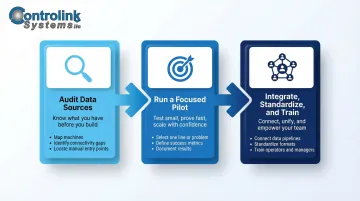
Step 1 — Audit Your Data Sources and Connectivity Gaps
Before selecting software, map which machines have sensors, which communicate via DNC or PLC integration, and which still rely on paper logs or manual data entry.
Key questions:
- Which machines have existing sensors or can be retrofitted?
- What communication protocols do your machines support?
- Where are the manual data collection points that could be automated?
- Which systems (MES, ERP, quality databases) need to receive real-time data?
Identify the gaps that would interrupt continuous data flow — these become your integration priorities.
Step 2 — Start with a Focused Pilot on a High-Impact Problem
Rather than attempting a facility-wide rollout, choose one machine, one production line, or one recurring quality issue to instrument first.
Define clear, measurable success metrics upfront:
- Reduction in unplanned downtime (hours per month)
- Scrap rate change (percentage of total production)
- OEE improvement (percentage point increase)
- Maintenance cost reduction (dollars saved per quarter)
A successful pilot gives you documented results — specific numbers you can use to make the case for broader rollout and secure buy-in from plant management.
Step 3 — Integrate Systems, Standardize Data, and Train Your Team
With a proven pilot in hand, the work shifts to scaling the infrastructure. Three areas require attention:
- Connect data pipelines between sensors, monitoring software, and business systems (MES, ERP, quality databases)
- Standardize data formats and collection intervals so metrics are consistent across machines and shifts
- Train floor operators and managers to act on dashboard alerts, not just review them at end of shift
Real-time data drives value only when it changes behavior. A dashboard that gets glanced at once a day is just an expensive report.
The Future of Real-Time Analytics in Manufacturing
AI and Generative AI Lowering the Barrier to Insight
Natural language query interfaces will allow floor supervisors and plant managers without data science backgrounds to ask questions of live production data directly: "Which machines had the highest unplanned downtime last week?" or "Show me quality trends for Part 12345 over the past month."
Edge AI will enable sub-second, machine-level adjustments without routing decisions through a central server — processing sensor data locally and triggering corrective actions instantly.
Sustainability and Energy Monitoring Becoming a Core Use Case
Real-time analytics now tracks per-machine energy consumption, identifies waste patterns, and helps manufacturers meet tightening regulatory and customer requirements around environmental compliance.
Implementing ISO 50001 and real-time energy monitoring can reduce energy costs by 10-20% within the first five years, putting energy performance on equal footing with throughput and yield as a metric plant managers actively manage.
Major OEMs are now enforcing energy mandates directly on their supply chains:
- Toyota requires direct suppliers to set annual CO2 reduction targets of at least -5.5%
- Ford mandates science-based GHG reduction targets with transparent reporting mechanisms
For suppliers to these OEMs, real-time energy monitoring is no longer optional — it's a condition of staying in the supply chain.
Frequently Asked Questions
What is real-time analytics in manufacturing?
Real-time analytics is the continuous collection and instant analysis of data from machines, sensors, and production systems — enabling immediate decisions rather than waiting for batch or historical reports. It surfaces actionable insights as events occur, not hours or days later.
How does real-time analytics help reduce downtime in manufacturing?
Continuous monitoring of equipment health signals — vibration, temperature, pressure — lets the system detect anomalies before a failure occurs. Maintenance teams can schedule repairs proactively rather than reacting to a breakdown, reducing unplanned downtime by 30–50% compared to reactive strategies.
What technologies are needed for real-time manufacturing analytics?
The core stack typically includes:
- IIoT sensors for data capture at the machine level
- Shop-floor connectivity software (DNC/process monitoring) to transmit and manage data
- Analytics platforms to process and visualize insights
- MES/ERP integration and edge or cloud infrastructure for broader system connectivity
What is the difference between real-time and near-real-time monitoring in manufacturing?
Real-time monitoring delivers data with negligible latency (milliseconds to seconds), while near-real-time involves a small delay (seconds to minutes). Both are valuable — the right choice depends on how quickly a given decision needs to be made. Emergency shutdowns require real-time; trend analysis can tolerate near-real-time.
How can small and mid-size CNC machine shops benefit from real-time analytics?
Shops with modest budgets can start by instrumenting their highest-utilization machines with DNC connectivity and process monitoring software. Gains in scrap reduction and machine utilization typically justify expanding to additional machines within months.
What KPIs should manufacturers track with real-time analytics?
Start with the metrics that connect most directly to financial performance:
- OEE (Overall Equipment Effectiveness)
- Unplanned downtime — frequency and duration
- Scrap and rework rates
- Cycle time versus target
- Machine utilization rate
These KPIs give a clear picture of operational efficiency and where losses are occurring.