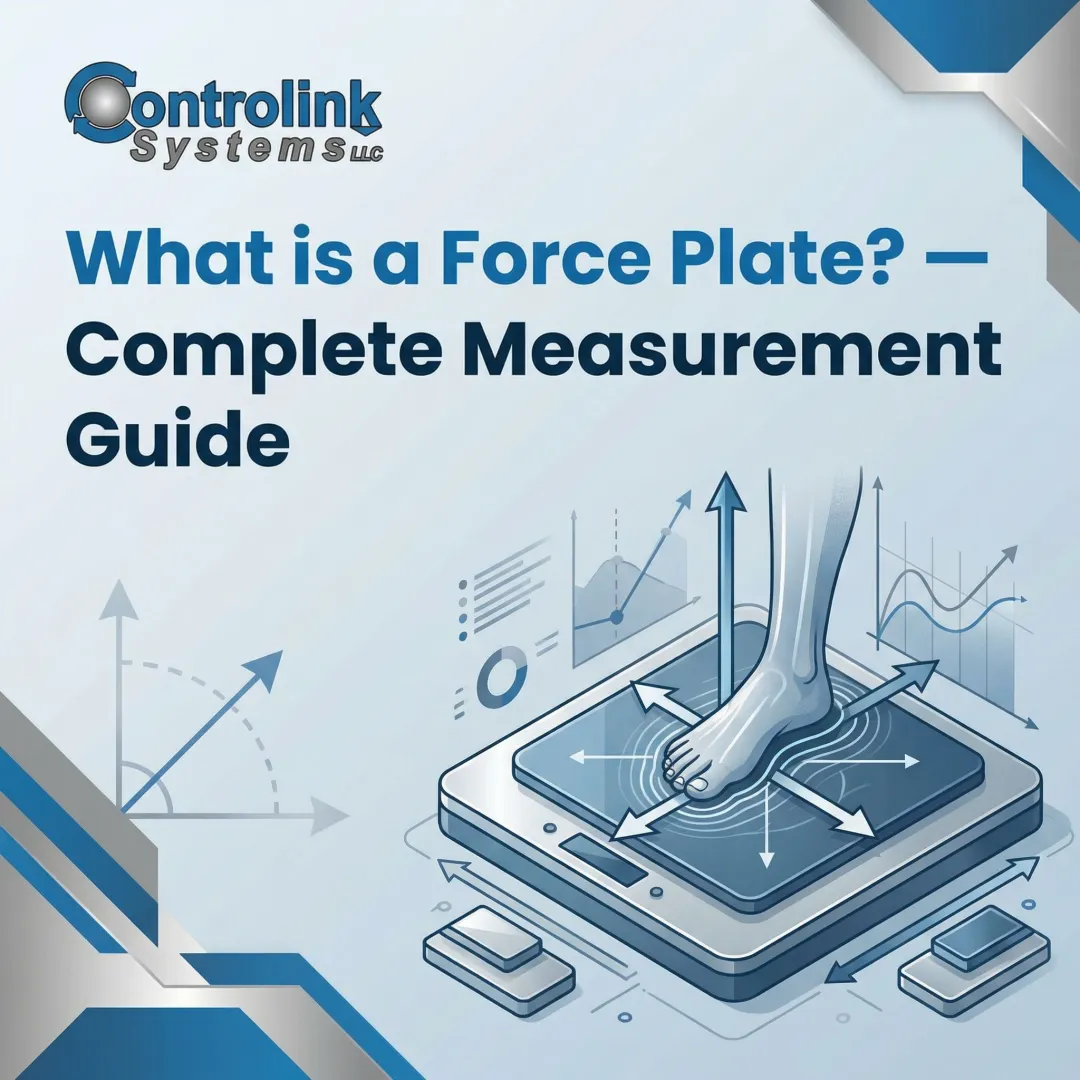
Introduction
Force plates have become the gold standard for balance assessment, giving clinicians and researchers precise, objective data that subjective observation simply can't provide.
For beginners, the data can feel overwhelming — dozens of metrics, unfamiliar terminology, no clear starting point. This guide cuts through that and explains what actually matters, in practical terms.
The clinical stakes make this worth understanding. In 2020, healthcare costs for non-fatal falls among older adults hit $80 billion in the US, with Medicare covering most of that. One in four adults over 65 falls each year. Objective screening tools that flag high-risk individuals early are one of the clearest ways to reduce that burden — and force plates are central to that screening.
TLDR
- Force plates track Centre of Pressure (CoP) movement during balance tasks—capturing how weight shifts dynamically, not just total body mass
- Lower values in key metrics like total excursion or sway ellipse area indicate better postural control
- Protocols range from bilateral quiet stance to single-leg eyes-closed tests, each revealing different stability aspects
- Each metric reflects a specific aspect of stability — conflating them, or comparing values across different protocols, is the most common beginner error
- Tracking the same individual over time reveals more than benchmarking against population averages
What Are Force Plate Measures of Balance?
Force plate balance measurement captures how vertical ground reaction force (GRF) shifts beneath a person's feet during standing or balance tasks. The system produces a continuous trace of the Center of Pressure (CoP)—the point where the net ground reaction force acts.
Static Weight vs. Dynamic Force Distribution
A bathroom scale measures static weight—total body mass at a single moment. A force plate captures something fundamentally different: dynamic force distribution over time.
The CoP reflects the central nervous system's active, time-varying regulation of the body's Center of Mass (CoM). As the body sways during standing, the postural control system generates stabilizing moments by continuously adjusting CoP position to keep the CoM within the base of support.
This dynamic tracking provides a sensitive measure of postural stability that static scales simply cannot detect.
Static vs. Dynamic Balance Assessment
Force plates support two main categories of balance testing:
Static balance assessment:
- Bilateral quiet stance (eyes open vs. closed)
- Single-leg standing
- Modified Romberg tests
- Foam-pad standing tasks
Dynamic balance assessment:
- Perturbation tests using mobile platforms
- Sit-to-stand transitions
- Functional movement tasks
- Reactive balance challenges
Static tasks primarily screen baseline stability and sensory integration, while dynamic tasks assess reactive control and athletic performance. How practitioners use each depends on their goals: sport scientists typically combine both for return-to-play decisions, while clinicians rely more heavily on static protocols for fall risk screening and rehabilitation progress tracking.
Key Metrics Force Plates Use to Quantify Balance
Center of Pressure (CoP) is the foundational metric in force plate balance testing. It represents the weighted average location of ground contact forces, and how it moves over time is the core signal practitioners analyze.
CoP Total Excursion
Total excursion measures the cumulative distance the CoP travels during a test window. Higher excursion reflects greater postural sway and less stability.
One important limitation: this metric is highly sensitive to test duration. A 30-second trial will always show higher excursion than a 10-second trial, even if stability quality is identical. Comparisons are only valid under identical conditions.
Mean CoP Velocity
Mean velocity equals total excursion divided by time. This normalizes for trial duration, making it more comparable across sessions and individuals.
Research shows mean CoP velocity has excellent test-retest reliability and consistently tracks age-related neuromuscular changes, making it many practitioners' preferred indicator of postural control quality.
Smaller values represent better balance efficiency — the neuromuscular system expends less effort maintaining stability.
CoP Ellipse Area (95% Confidence Ellipse)
The 95% confidence ellipse encompasses 95% of CoP data points during a trial, capturing both amplitude and directionality of sway in a single value.
When interpreting ellipse area, two things matter:
- A smaller ellipse generally indicates tighter, more controlled sway — but an excessively small area can signal rigid "freezing" rather than healthy adaptive control
- Ellipse shape reveals whether sway occurs primarily anteroposterior (forward-backward) or mediolateral (side-to-side), helping pinpoint specific neuromuscular deficits
The Absence of Universal Norms
No universal consensus exists on exact "normal" ranges for these metrics. Context factors heavily influence results:
- Age and fitness level
- Footwear and surface conditions
- Stance width and foot placement
- Test protocol and duration
- Sampling rate and filtering
Individual baselines and within-subject tracking matter far more than comparing against population norms. Establish your own standardized protocol, then track changes over time.
How Force Plate Balance Assessment Works – Step by Step
Even small setup errors can distort CoP data and invalidate your results. Here are the six practical stages of running a reliable force plate balance test.
Step 1 – Define the Test Protocol
Specify every parameter before testing begins:
- Stance type: Bilateral vs. single-leg
- Visual condition: Eyes open vs. closed
- Surface: Firm platform vs. foam pad
- Trial duration: Typically 10–30 seconds (25–40 seconds for static tasks per research standards)
- Number of repetitions: Usually 3 trials per condition
Mixing protocols without documentation is the most common beginner error. It makes longitudinal tracking impossible and invalidates comparisons.
Step 2 – Prepare the Subject and Platform
Set up the subject consistently across all sessions:
- Mark foot placement with tape (consistent angle and width)
- Arms at sides, relaxed
- Gaze fixed at a target point at eye level
- No talking during trial
- Remove shoes or standardize footwear across all sessions
Zero (tare) the force plate before each trial. Skipping this step introduces a false offset into every GRF reading for that trial.
Step 3 – Record the Force-Time Data
During data capture, the force plate samples GRF at high frequency. Research-grade systems typically use 1,000 Hz or higher internal sampling to prevent signal aliasing. This produces a time-series of vertical and horizontal force components from which the software continuously calculates CoP position.
Sampling rate considerations:
- Hardware should capture at 1,000 Hz
- Static posturography frequency content stays below 10 Hz
- Analysis can safely use 100 Hz after appropriate filtering (10 Hz low-pass cutoff)
Step 4 – Extract and Review CoP Metrics
Software automatically derives CoP trajectory from raw force-time data, then calculates key balance metrics (excursion, velocity, ellipse area).
Before reading numbers, review the CoP path visually. Irregular or asymmetric paths often signal compensation patterns worth investigating further. Look for:
- Excessive drift in one direction
- Clustered vs. scattered data points
- Asymmetric ellipse shapes
- Sudden position shifts
Step 5 – Interpret Results in Context
Correct interpretation requires contextual analysis:
Compare against the individual's baseline rather than population norms. Account for variables like:
- Fatigue and time of day
- Recent injury or training load
- Medication changes
- Surface and footwear consistency
Look for directional patterns in the CoP ellipse. Excessive anteroposterior sway may indicate ankle strategy deficits, while excessive mediolateral sway often points to hip strategy problems or vestibular issues.
Step 6 – Document and Track Over Time
A single balance test snapshot has limited clinical or performance value. The real power comes from repeated assessments under identical conditions.
This enables practitioners to:
- Track change over time and catch declining balance before it becomes a clinical problem
- Evaluate whether an intervention is actually working
- Adjust training or treatment plans based on measured trends
Document every protocol detail: stance width, foot angle, trial duration, surface type, time of day, and any deviations from standard procedure.

Real-World Applications of Force Plate Balance Testing
Sports Performance and Return-to-Play
Force plates detect bilateral load asymmetries during standing tasks that visual observation misses. Single-leg stability serves as a readiness indicator for return-to-sport decisions.
Research on ACL-reconstructed athletes shows persistent lower limb asymmetries on force plate testing, even after athletes achieve satisfactory clearance on conventional strength and horizontal hop testing. Athletes who later sustain noncontact lower extremity injuries show significantly increased CoP displacement — meaning their center of pressure shifts further and faster — during the transition from double-leg to single-leg stance.
Key force plate findings in sports performance:
- Detect bilateral load asymmetries that pass visual observation unnoticed
- Flag CoP instability during stance transitions missed by hop testing
- Identify athletes at elevated reinjury risk before symptoms appear
- Support objective, data-backed return-to-play timelines
Clinical Rehabilitation Progress Tracking
Force plates provide objective documentation of balance progress in post-surgical and neurological patients. They support data-driven decisions on when patients are ready to advance through rehabilitation stages.
Clinical applications:
- Detect compensatory movement strategies before they become problems
- Track weight-bearing asymmetry in stroke recovery
- Monitor progress after total hip arthroplasty
- Identify persistent deficits invisible to observational scales
In patients recovering from unilateral total hip arthroplasty, force plates reveal persistent marked asymmetries in body-weight distribution during standing and sit-to-stand tasks that can last more than a year post-surgery.
Fall Prevention in Aging Populations
Traditional clinical tests like the Timed Up and Go (TUG) have high specificity but notoriously low sensitivity (31%) for predicting falls, meaning many high-risk individuals go undetected.
Force plate CoP parameters—specifically sway area, anteroposterior mean velocity (front-to-back sway speed), and radial mean velocity—effectively discriminate fallers from non-fallers. For clinicians, this means earlier intervention and more targeted exercise prescriptions before a fall event occurs.
Comparison of Assessment Tools:
| Tool | Sensitivity to Mild Deficits | Fall Risk Prediction | Primary Limitation |
|---|---|---|---|
| Berg Balance Scale | Low | Poor to Moderate | Severe ceiling effects in high-functioning patients |
| Timed Up and Go | Moderate | Low (31% sensitivity) | Misses many high-risk individuals |
| Force Plate CoP Metrics | High | Good | Requires standardized protocols and equipment |

Isolating Sensory System Deficits
The instrumented modified Clinical Test of Sensory Interaction on Balance (mCTSIB) uses foam pads and eye closure on a force plate to systematically remove visual and proprioceptive inputs.
Protocol conditions:
- Firm surface, eyes open (all systems available)
- Firm surface, eyes closed (removes vision)
- Foam surface, eyes open (disrupts proprioception)
- Foam surface, eyes closed (removes vision and proprioception)
This allows therapists to pinpoint specific sensory deficits — visual, vestibular, or proprioceptive. A patient who scores poorly only on condition 3 likely has a proprioceptive deficit; one who struggles on condition 4 may have a vestibular compensation issue. That distinction drives targeted rehabilitation programming rather than generic balance exercises.

How Controlink Systems Can Help
Controlink Systems LLC provides NI-based data acquisition hardware and process monitoring software that research laboratories and test facilities use when building or integrating custom force plate measurement systems.
With over 25 years of experience in high-speed signal acquisition, multi-channel measurement, and real-time monitoring software, Controlink brings expertise directly applicable to precision balance testing. Their work spans manufacturing process control and engineering test facilities — environments where data capture requirements closely mirror those of force plate systems: high sampling rates, synchronized multi-channel acquisition, and reliable time-stamped data.
Relevant capabilities for force plate integration:
- Multi-channel analog signal acquisition (capturing Fx, Fy, Fz, and moment channels simultaneously)
- High-speed data capture at 1,000 Hz or higher
- Real-time monitoring and visualization dashboards
- Custom reporting pipelines and automated data workflows
- Integration with existing laboratory information systems
Controlink has supported research environments including national laboratories such as Oak Ridge National Laboratory. For organizations that need more than off-the-shelf force plate software — whether integrating balance data into broader testing workflows, building custom dashboards, or automating reporting — their data acquisition solutions can be configured to match specific lab requirements.

Contact Controlink Systems at (800) 838-3479 to explore how their data acquisition and monitoring expertise can support your force plate testing environment.
Frequently Asked Questions
What does a force plate measure?
A force plate measures ground reaction force—the force the body exerts on the ground. During balance testing, it tracks the Centre of Pressure (CoP), the point where this force acts, and how that point shifts over time as the body maintains postural stability.
What is Centre of Pressure (CoP) and why does it matter for balance assessment?
CoP is the real-time location of the net ground reaction force vector on the plate surface. Its movement pattern over time, measured by excursion distance, velocity, and sway area, directly reflects how hard the neuromuscular system works to maintain upright balance.
What balance tests are commonly performed on a force plate?
Common protocols include bilateral quiet stance (eyes open and closed), single-leg stance, modified Romberg tests, and foam-pad standing tasks. Each protocol stresses different sensory systems (visual, vestibular, proprioceptive) and reveals different aspects of postural control.
How is force plate balance testing different from traditional clinical balance assessments like the Berg Balance Scale?
Traditional scales rely on clinician-rated observation of task performance, which introduces subjectivity and ceiling effects. Force plates produce continuous, objective, high-resolution CoP data that detect subtle postural changes too small to observe visually, making them well-suited for tracking incremental progress in rehabilitation.
What is a "normal" CoP range for balance assessment?
CoP norms vary widely by age, test protocol, and surface conditions. Most practitioners track an individual's own baseline over time rather than comparing to fixed reference values, though research-based normative datasets exist for specific populations.
Why does the Berg Balance Scale have a ceiling effect?
The Berg Balance Scale suffers from a significant ceiling effect in active or mildly impaired populations. Studies show as many as 73% of functionally fit older adults obtain the maximum possible score, rendering the test incapable of detecting subtle balance deficits or tracking further improvements.